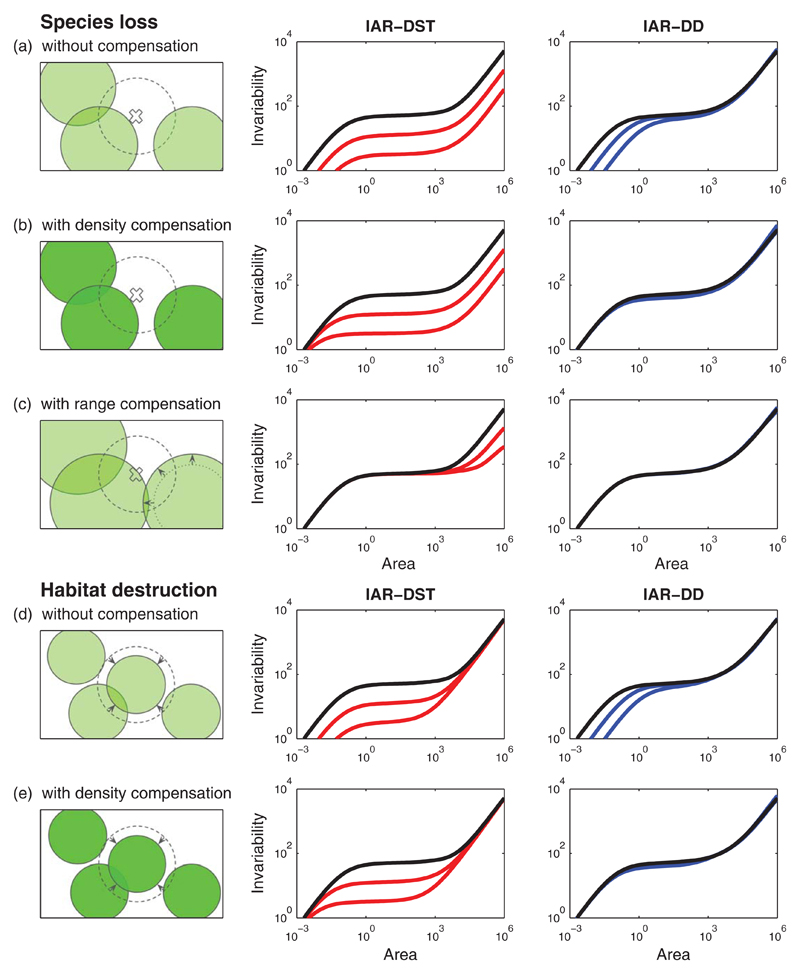
Figure 3.
Simple scenarios of global change affect stability in various ways across spatial scales. We consider five scenarios: (a) Species loss alone, (b) species loss associated with an increase in population density, (c) species loss associated with an increase in range size, (d) habitat destruction alone and (e) habitat destruction associated with an increase in population density. Left column: illustration of simulated landscape. Middle column: Decorrelation by species turnover (IAR-DST; in red). Right column: Decorrelation by distance (IAR-DD; in blue). Reference IARs for the initial landscape (black line) are the same across scenarios. Parameter values of the reference IARs are the same as in Figure 2, except ρ0=1/λSQ=0.02 and D0=Q/2=5103. Parameter changes are (a) λS → λS/γ, (b) λS → λS/γ and λI → γλI, (c) λS → λS/γ and Q → γQ, (d) Q → Q/γ, and (e) Q → Q/γ and λI → γλI, where the factor γ is equal to γ = 4 for the curve closest to the reference, and equal to γ = 16 for the curve furthest from the reference

