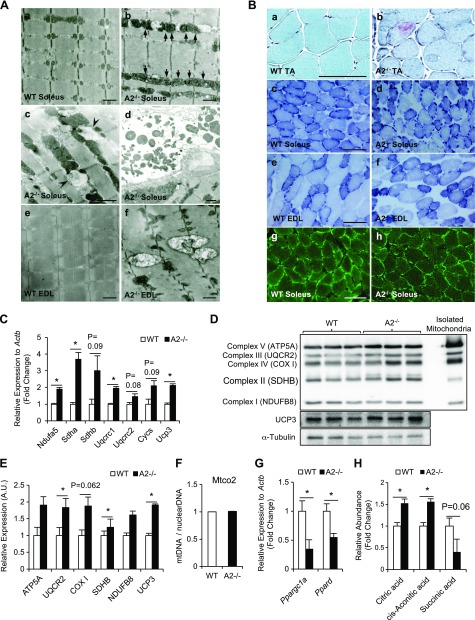
Figure 2.
Apobec2 deficiency causes mitochondrial defects in skeletal muscle. A) Ultrastructural analyses of soleus (slow-type) and EDL (fast-type) muscles from 15-wk-old WT and Apobec2−/− mice by electron microscopy. A) a, b) Arrows indicate elongated intermyofibrillar mitochondria with dense cristae in soleus muscle of Apobec2−/− mice; no such mitochondria were seen in WT mice. c, d) Arrowheads indicate autophagosome-like vacuoles around mitochondria (c) and abnormal subsarcolemmal mitochondria in soleus muscle of Apobec2−/− mice (d). e, f) Enlarged mitochondria in EDL muscle of Apobec2−/− mice; no such mitochondria were seen in WT mice. Scale bars, 2 μm. B) Histologic analyses to characterize the effects of Apobec2 deficiency on the mitochondria in skeletal muscle from 15-wk-old WT and Apobec2−/− mice. a, b) Gomori trichrome staining of TA muscles shows damaged mitochondria by the presence of ragged red fibers in the cytosol of Apobec2−/− mice. c–f) NADH-TR staining of soleus and EDL shows thick and dense subsarcolemmal mitochondria and less-ordered and more coarse areas in the cytoplasm of Apobec2−/−. g, h) Immunostaining with anti-TOM20 of soleus muscles shows enlarged and disordered mitochondria in Apobec2−/− mice. Scale bars, 100 μm. C) Relative expressions of mitochondrial respiratory or uncoupling genes relative to Actb (reference gene) in soleus muscle from 15-wk-old WT and Apobec2−/− mice. D) Immunoblot analysis of mitochondrial oxphos (ATP5A, UQCR2, COX I, SDHB, and NDUFB8) and UCP3 of soleus muscles from 15-wk-old WT and Apobec2−/− mice normalized to α-tubulin. E) Graphs represent relative expression levels normalized to α-tubulin. *P < 0.05 (n = 3 for each group). F) mtDNA (Mtco2) was measured relative to 18S rRNA as the control for nuclear genome DNA. G) Expression of Ppargc1a and Ppard mRNA in soleus muscle from WT and Apobec2−/− mice relative to Actb (reference gene). H) Relative abundance of mitochondrial TCA metabolites in TA muscles from 15-wk-old WT and Apobec2−/− mice measured by capillary electrophoresis mass spectrometry. Data are means ± sem. *P < 0.05 (n = 4 for each group).

