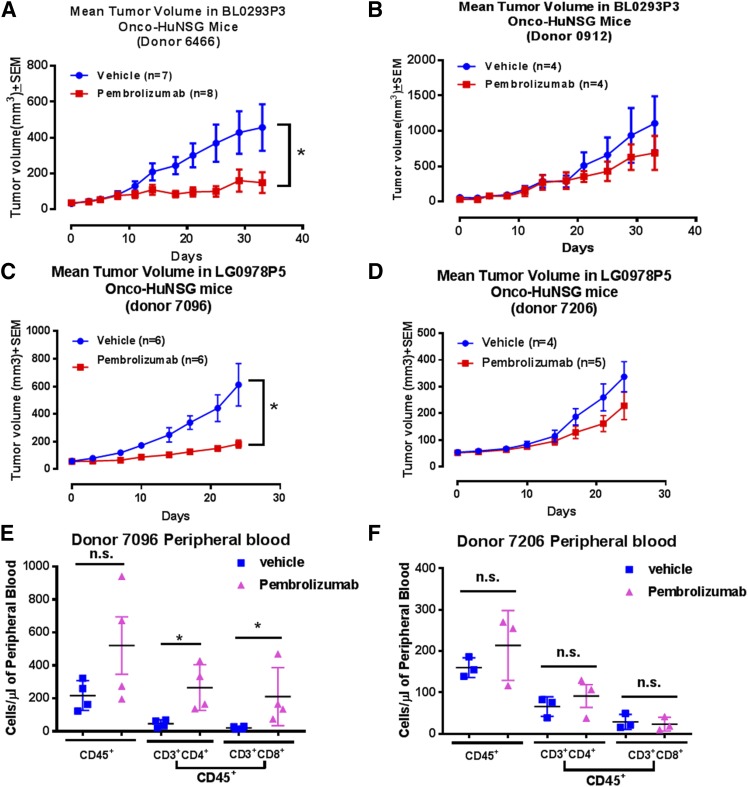
Figure 3.
Donor variations in response to pembrolizumab treatment in bladder (BL0293P3) and NSCLC (LG0978P5) Onco-HuNSG mice. A, B) Tumor growth curves of PDX bladder tumor BL0293P3 Onco-HuNSG in responder and nonresponder donors. The BL0293P3 tumor was implanted subcutaneously into HuNSG mice, established from 2 donor CD34+ HPSC sources: donor 6466 (A) and donor 0912 (B). Vehicle control saline was injected intraperitoneally twice a week until the end of the study. Pembrolizumab was injected 10 mg/kg, i.p. on d 0 followed by 5 mg/kg twice a week until the end of the study. C, D) Tumor growth curves of PDX NSCLC (LG0978P5) Onco-HuNSG in responder and nonresponder donors. The LG0978P5 tumor was trocared subcutaneously into HuNSG mice from 2 donor CD34+ HPSC sources: donor 7096 (C) and donor 7206 (D). Vehicle control saline was injected intraperitoneally every 5 d for 20 d on d 0, 5, 10, 15, and 20. Pembrolizumab was injected at 10 mg/kg, i.p. on d 0, followed by 5 mg/kg, i.p. injection on d 5, 10, 15, and 20. E, F) Whole blood from NSCLC (LG0978P5) Onco-HuNSG donor 7096 (E) and donor 7206 (F) mice was processed into single-cell suspension and stained for hCD45, hCD3, hCD4, and hCD8, as described in Materials and Methods, for flow cytometric analysis. Nonparametric Mann-Whitney U test was performed to compare the cell numbers in different treatment groups. *P < 0.05.

