Figure 1.
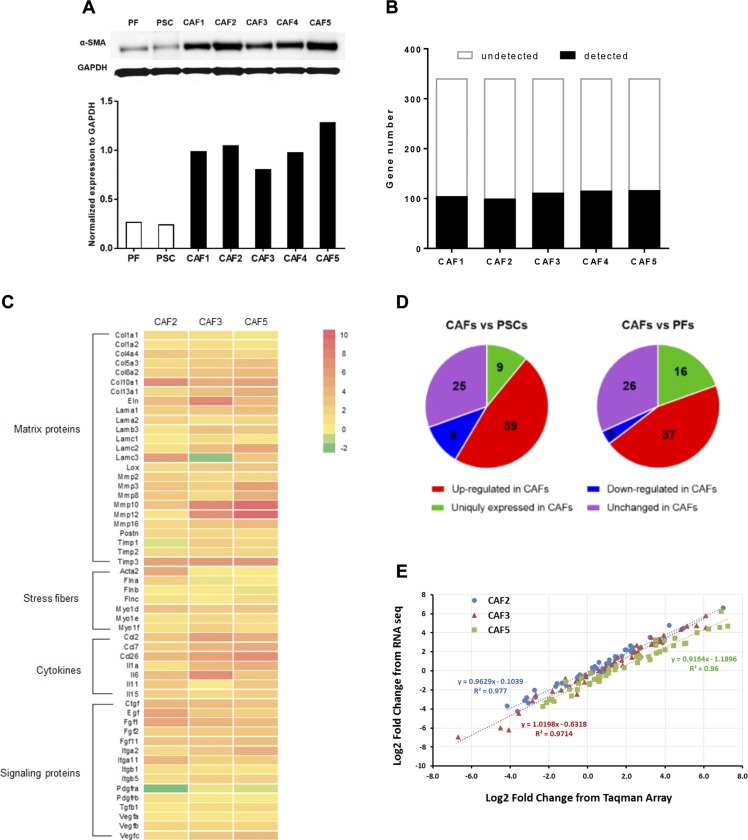
Myofibroblastic phenotype and GPCR expression of pancreatic CAFs. A) Immunoblot of α-SMA in PFs, PSCs, and 5 primary CAF cell lines (CAF1–5); expression of α-SMA was normalized to that of glyceraldehyde-3-phosphate dehydrogenase (GAPDH). B) TaqMan GPCR array analysis of nonchemosensory GPCR expression in 5 CAF lines. GPCR expression was quantified as the ΔCt between a GPCR and 18S rRNA; detected GPCRs were those with a ΔCt ≤ 25. Supplemental Table S1 lists the GPCRs detected in CAFs, PSCs, and PFs. C) Heat map of the selected CAF marker genes based on RNA sequencing analysis of PSC and 3 primary CAF cell lines (CAF2, CAF3, and CAF5). Data are presented as log2 fold-change of gene expression in each CAF compared with PSCs. Genes were categorized by 4 profibrotic features: matrix proteins, stress fibers, cytokines, and signaling proteins. D) Expression of 82 GPCRs detected in all 5 CAFs compared with PSCs and PFs. Expression difference was quantified as fold-change (fold change = 2(ΔCt_PSC or ΔCt_PF −ΔCt_CAF)). GPCRs were grouped as up-regulated (fold-change >2), down-regulated (fold-change < 0.5), unchanged (0.5 ≤ fold change ≤ 2), or uniquely expressed in CAFs (i.e., not detected in PSCs/PFs.) E) Log2-fold change of the 50 most abundant GPCRs in CAFs compared with PSCs, as determined by RNA sequencing plotted against the same from TaqMan GPCR arrays; linear regressions and correlation coefficients are indicated.

