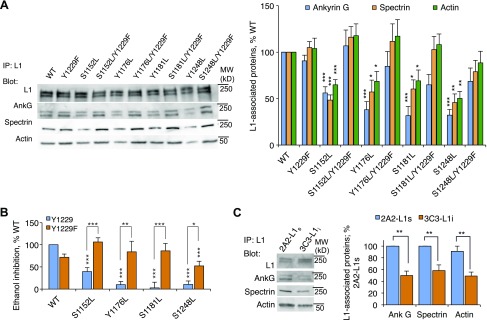
Figure 4.
Effect of OLIPS mutations on L1 association with ankyrin and L1 sensitivity to ethanol. A). Representative Western blot and densitometric analysis of L1 association with ankyrin-G, spectrin, and actin in cells expressing single OLIPS leucine mutations in the absence and presence of the Y1229F mutation (F = 7.72; P < 0.0001). *P < 0.05; **P < 0.01; ***P < 0.001 (n = 6–17). B) Ethanol inhibition of L1 adhesion in the constructs shown in A (F = 9.27; P < 0.0001). *P < 0.05; **P < 0.01; ***P < 0.001 (n = 9–142). C) Association of ankyrin-G, spectrin, and actin with L1 in 2A2-L1s cells vs. 3C3-L1i cells (F = 10.69; P < 0.0001). **P < 0.01 (n = 6–11).

