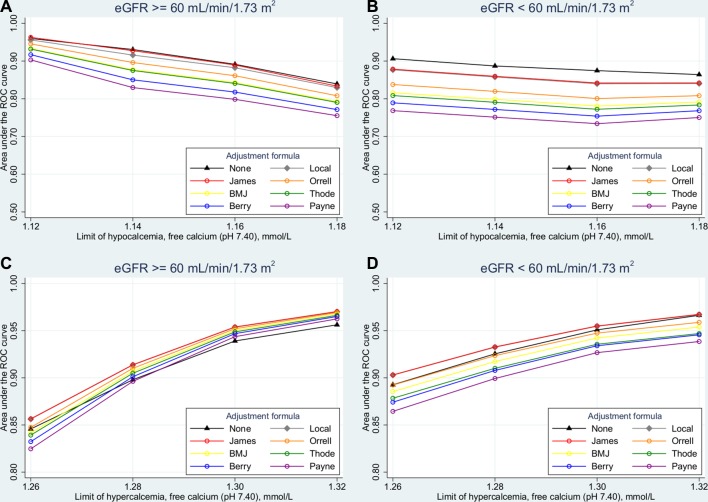
Figure 1.
Accuracy in the diagnosis of (A) and (B) hypocalcaemia and (C) and (D) hypercalcaemia in patients with estimated glomerular filtration rate (eGFR) (A) and (C) above or (B) and (D) below 60 mL/min/1.73 m2, given as the area under the receiver operating characteristic (ROC) curve for various albumin-adjustment formulas and for unadjusted calcium.

