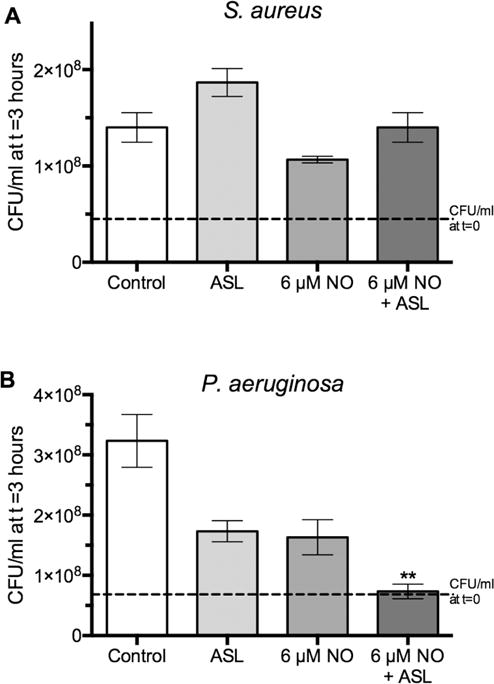
FIGURE 4.

Susceptibility of log-phase S aureus and P aeruginosa to ASL from ALI cultures, with and without the addition of 6 μmol/L NO. All growth data are presented as fold increase in CFUs/mL after a 3-hour growth period. All experimental conditions were compared with the control condition (2-way ANOVA, **p < 0.01; n = 3 per condition). Dashed line demonstrates bacterial concentration at t = 0. ANOVA = analysis of variance. ALI = air-liquid interface; ANOVA = analysis of variance;ASL = airway surface liquid; CFUs = colony forming units.
