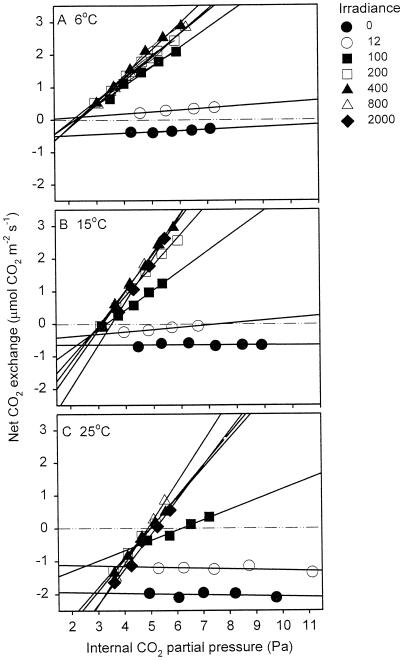
Figure 1.
Example of the effect of irradiance on net CO2 exchange (μmol CO2 m−2 s−1) versus pi of a single leaf at three temperatures: 6°C (A), 15°C (B), and 25°C (C). Measurements were also conducted at 10°C, 20°C, and 30°C (not shown). The symbols represent the irradiances under which each set of measurements was made (in μmol photons m−2 s−1). Lines represent the linear regressions at each irradiance.

