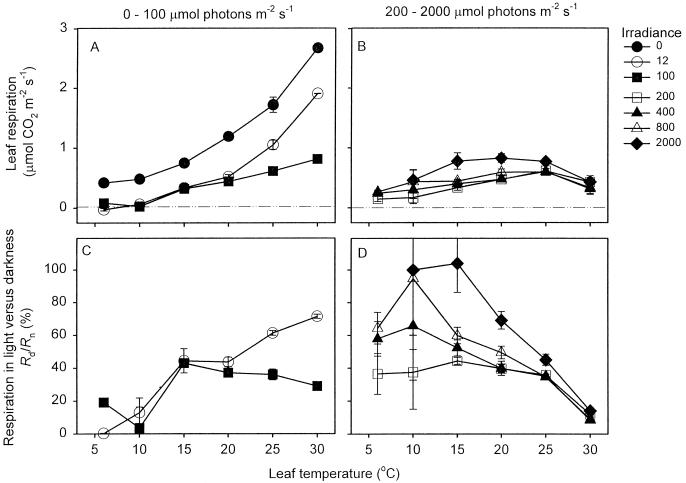
Figure 5.
Effect of irradiance on the relationship between temperature and R. Values for 0 to 100 μmol photons m−2 s−1 are shown in A and C, whereas B and D show values for 200 to 2,000 μmol photons m−2 s−1. Values of R were calculated using the linear regressions of net CO2 exchange versus Pi at each irradiance (e.g. Fig. 1), our estimate of Γ*25 (4.31 Pa), and the temperature dependence of Γ* given in Equation 3. A and B show the absolute rates of leaf respiration, while C and D show rates in the light as a percentage of those in darkness.

