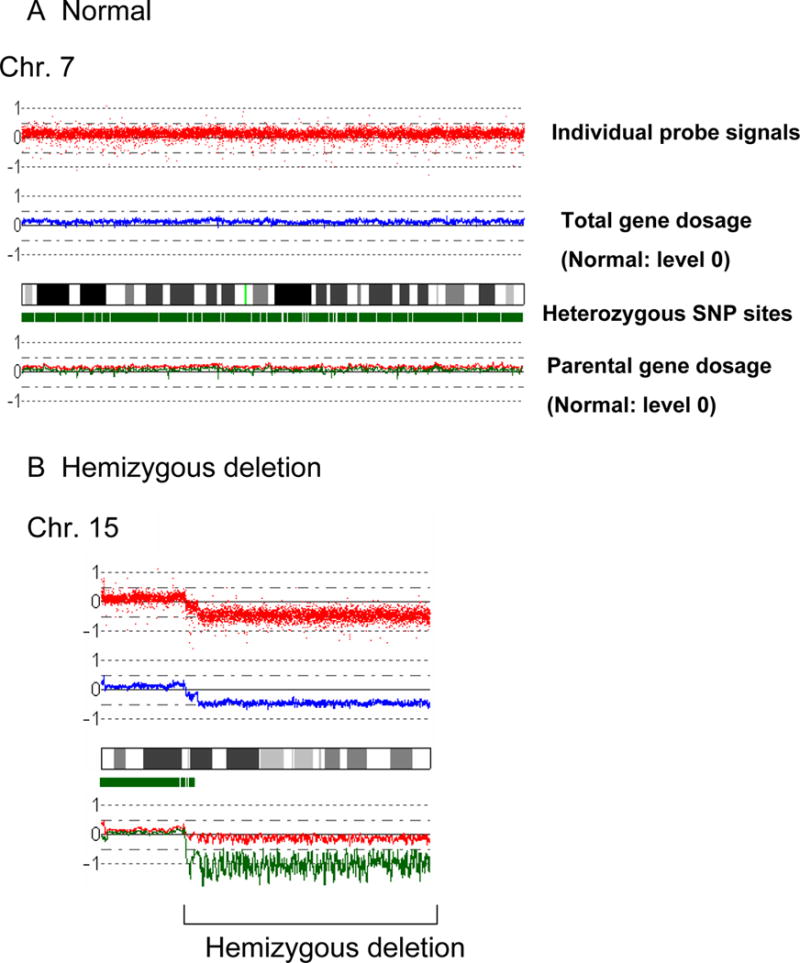
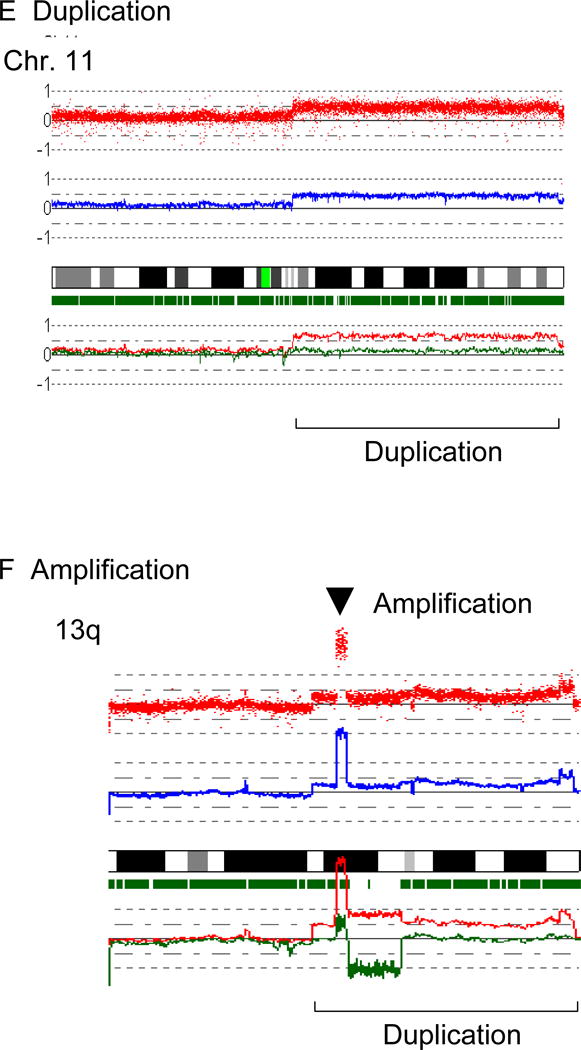
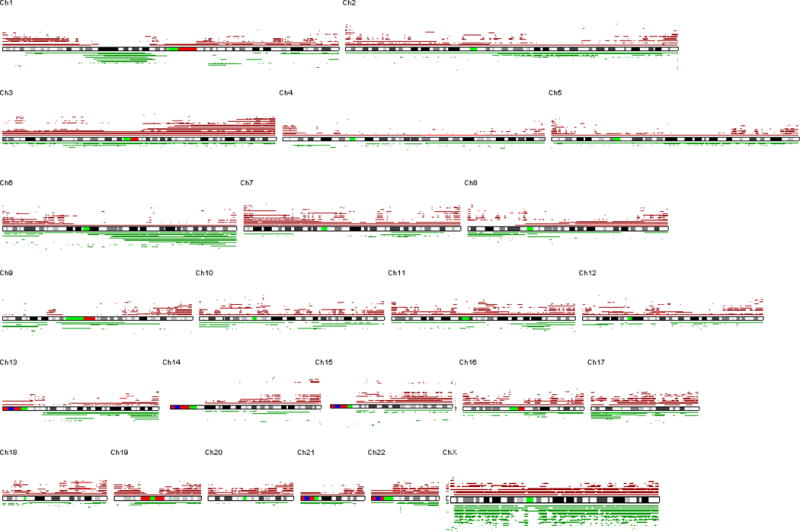
Figure 1. Results of SNP-chip analysis.


Representative results and the overview of genomic status of 33 MCL identified by SNP-chip are shown.
A: Normal chromosome. Top panel shows individual SNP probe signals; intensity of the signals are almost the same over the entire chromosome. Second panel indicates gene dosage level; gene dosage is normal over the chromosome. Third panel shows heterozygosity SNP sites by green rectangles. Heterozygous SNP site are frequently detected over the chromosome. Fourth panel indicates gene dosage of each parental allele (green or red line); level of each allele is identical over the chromosome.
B: Hemizygous deletion. Region of hemizygous deletion is delineated by brackets.
C: Homozygous deletion. Arrow indicates a site of homozygous deletion; each parental allele (red or green line) has a deletion at this site.
D: Acquired uniparental disomy (aUPD). aUPD is a site which has loss of heterozygosity with normal gene dosage; one of the parental alleles is missing (green line) and the other allele is duplicated (red line). aUPD region is indicated by brackets.
E: Duplication. Duplicated region is indicated by a parenthesis.
F: Amplification. Arrowhead indicates the sites of high copy number amplification. This case also has duplication at 13q as indicated by the brackets.
G: SNP-chip data of 33 cases of MCL. Deleted regions are indicated by green lines under each chromosome panel; and duplications/amplifications are indicated by brown lines above each chromosome panel.
