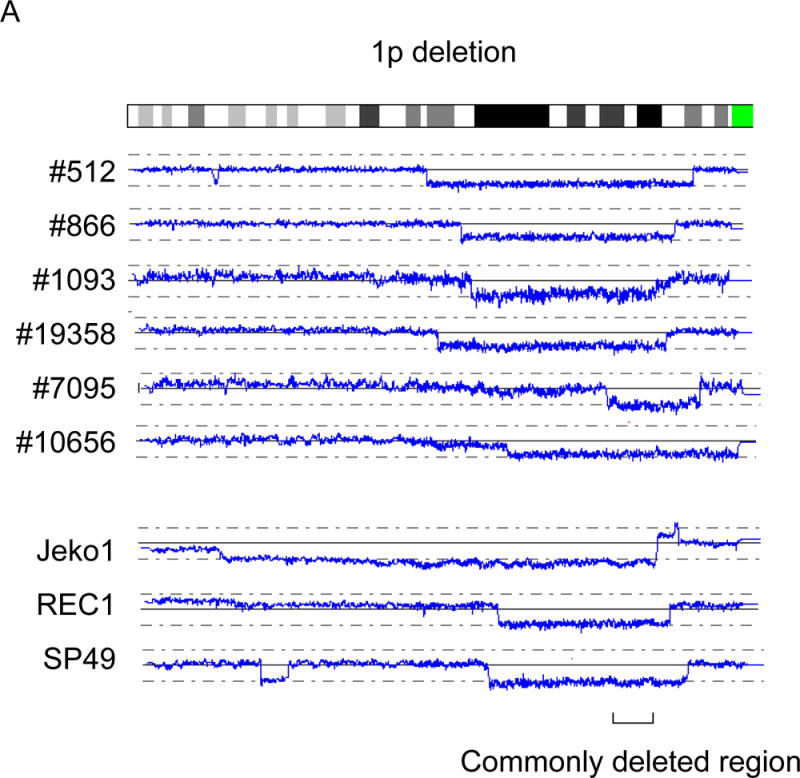
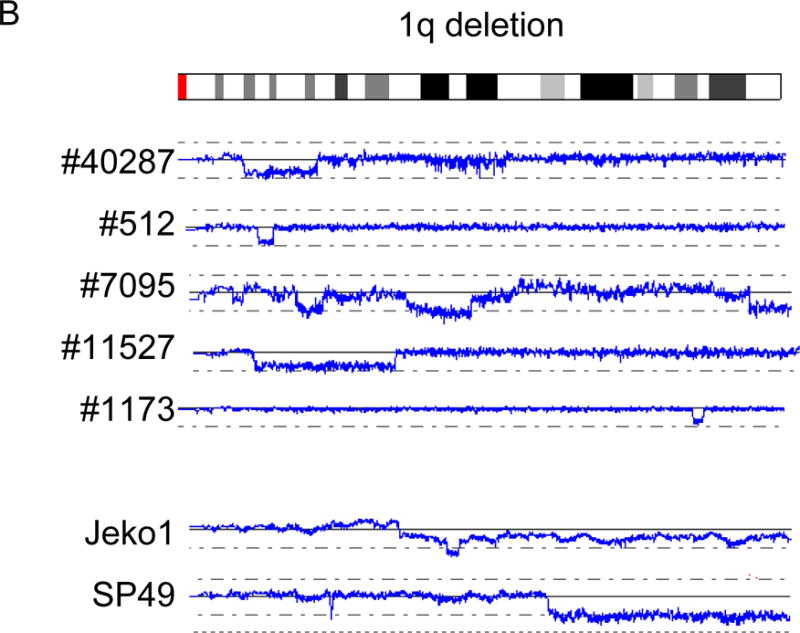
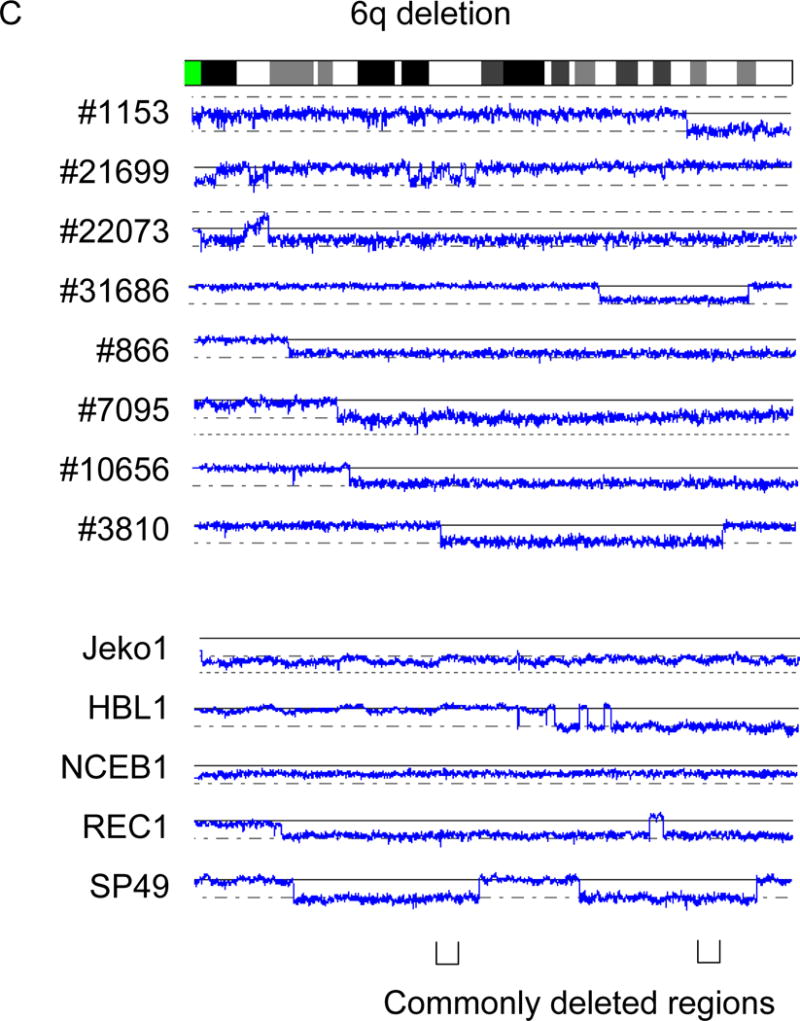
Figure 3. Recurrent deletions in MCL.


Recurrent deletions of 1p, 1q and 6q are shown. A: Deletion of 1p. B: Deletion of 1q. C: Deletion of 6q. Commonly deleted regions are indicated by parenthesis. Cell line names and sample numbers are indicated. Blue lines indicate gene dosage levels of each case.
