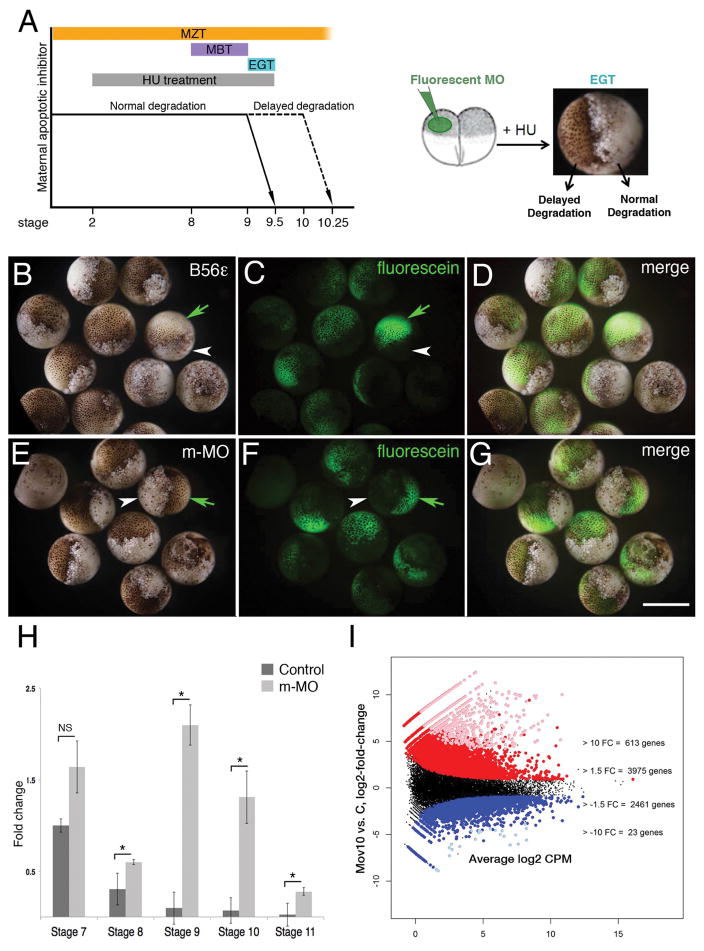
Figure 3. Mov10 regulates MZT through RISC.
A) Schematic of developmental time periods and the Hydroxyurea (HU) assay. The Maternal to Zygotic Transition (MZT) spans between stage 1 and stage 10. The Mid-Blastula Transition (MBT) lies between stages 8 to 9. Early Gastrula Transition (EGT) occurs between stage 9 to 9.5. Hydroxyurea (HU) treatments lasted from the two-cell stage to stage 9.5. At the two-cell stage one of the blastomeres was injected with fluorescein-tagged morpholinos and the embryos were treated with HU until stage 9.5. B–D) Images of stage 9.5 embryos, where one cell had been injected with morpholino, targeting a positive regulator of MZT (B56ε) at the 20-cell stage. A total of 22 embryos were injected, and 21 of those showed the expected phenotype. Green arrows point to the live progeny of the injected cell in one of the cases shown. White arrowheads point to the dead progeny of the uninjected cell. E–G) Images of stage 9.5 embryos, where only one cell was injected with m-MO. A total of 22 embryos were injected and all of them showed the expected phenotype. H) qRT-PCR of cyclin A1 levels in control and m-MO embryos at indicated stages. Error bars represent SEM. NS- Not significant, p *<0.05 (Student’s t-test, two-tailed). I) Differential expression results for maternal Mov10 morpholino (m-MO) injected (Mov10) vs. control embryos (C), X-axis-average expression value (TMM-normalized Counts Per Million, log2 scale) of each X. laevis gene and y-axis is log2 (Mov10/C). Each point is a single gene: groups of genes colored red or blue had significantly greater than or less than 1.5 FC difference (unlogged), respectively. Groups of genes colored pink or light blue also had significantly greater than or less than 10 FC difference (unlogged), respectively. The numbers of genes listed at the +/− 1.5 FC level include the genes with +/− 10 FC. Scale bar in G equals 100μm for A an 300μm for B–G. Gene identities and statistical analysis are in Supplemental Table 2 (accessible through NCBI GEO accession number GSE86382).

