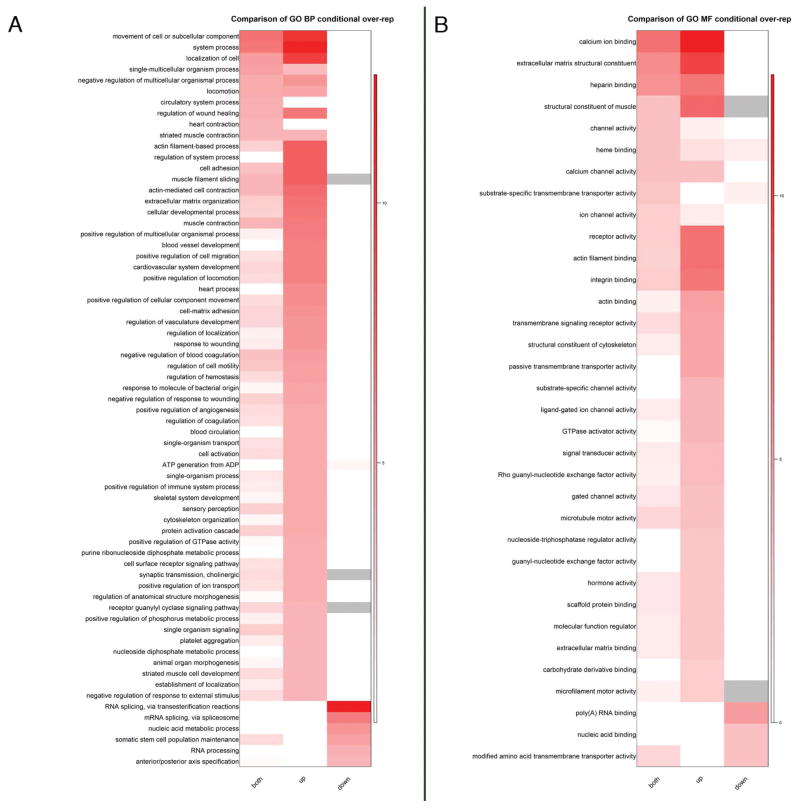
Figure 4. Gene ontology analysis (GO) of significantly changed RNAs between mMO injected and control embryos.
A) Heat maps of –log10 (p-values) showing the comparison of all significantly changed (both), up- or down-regulated gene sets from X. laevis for Biological Process (BP) category. Due to the larger number of BP terms, only those with raw p-values < 0.0001 in any gene set were included in the heatmap. B) Heat maps of –log10 (p-values) showing the comparison of all (both), up or down gene sets from X. laevis for Molecular Function (MF) category. GO terms with raw p-values < 0.001 in any gene set were included for MF.

