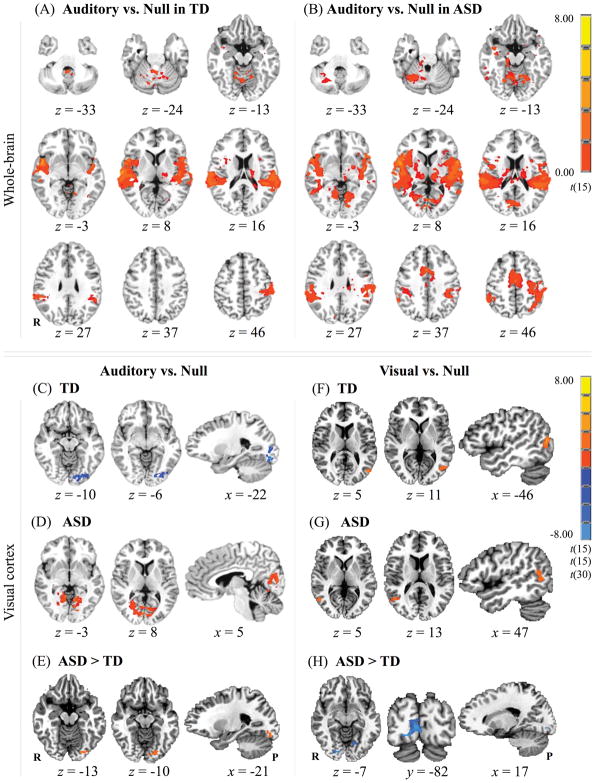
Figure 3.
Statistical parametric maps. (A–B) Whole-brain clusters of activity for the auditory vs. null contrast in: (A) TD; and (B) ASD. (C–E) Activation clusters within the visual cortex for the auditory vs. null contrast in: (C) TD; (D) ASD; and (E) ASD > TD. (F–H) Clusters of activity within the visual cortex for the visual vs. null contrast in: (C) TD; (D) ASD; and (E) ASD > TD. Data are and presented in radiological convention (R = right, P = posterior).

