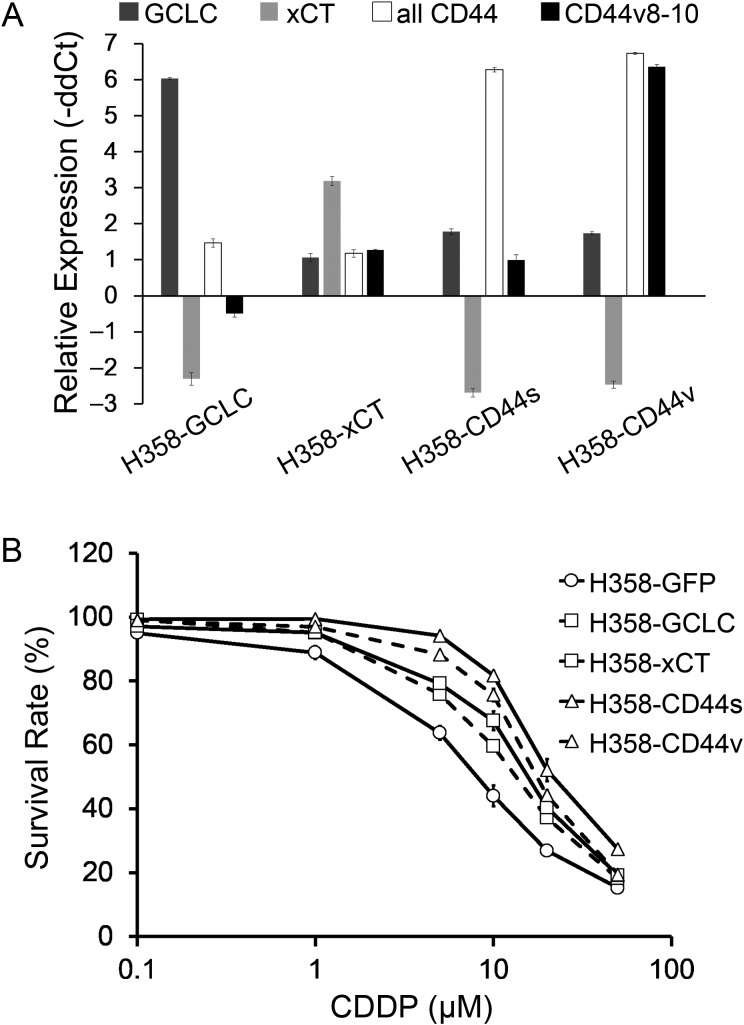
Figure 1.
mRNA expression levels of GCLC, xCT, all CD44 and CD44v8-10, and survival rate of cisplatin-exposed stable H358 cell lines. (A) mRNA expression levels in the stable cell lines relative to H358-GFP analyzed by qRT-PCR with GAPDH expression as an internal calibrator. Whiskers indicate the standard error from triplicate experiments. (B) Survival rates of stable cell lines exposed to cisplatin at various concentrations. Whiskers show standard error calculated from the results of more than three independent experiments.

