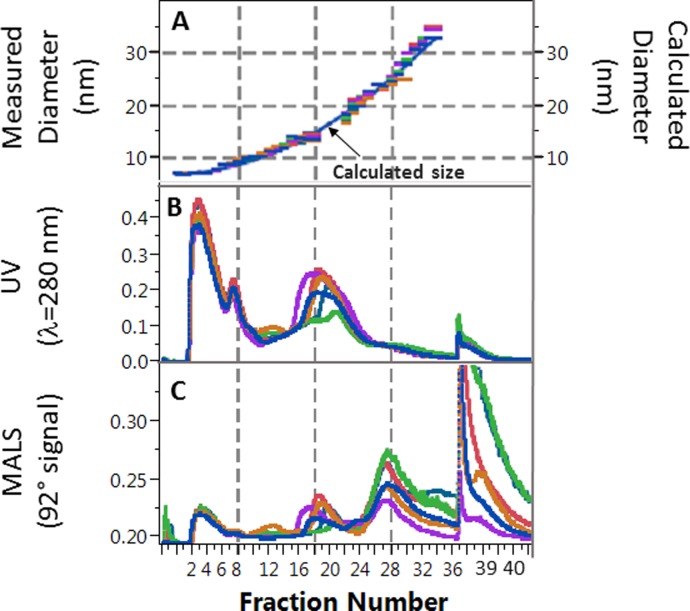
Fig 1. Overlay of data for six serum samples from a representative asymmetric flow field-flow fractionation run.
A: Overlay of average hydrodynamic diameter measured by dynamic light scattering vs. fraction number. Continuous line shows calculated size based on quadratic fit. B: Overlay of corresponding UV signal during fractionation. C: Overlay of 92° signal from the multi-angle light scattering (MALS) detector during fractionation. Grid lines are shown for ease of visualization of fraction numbers across graphs.

