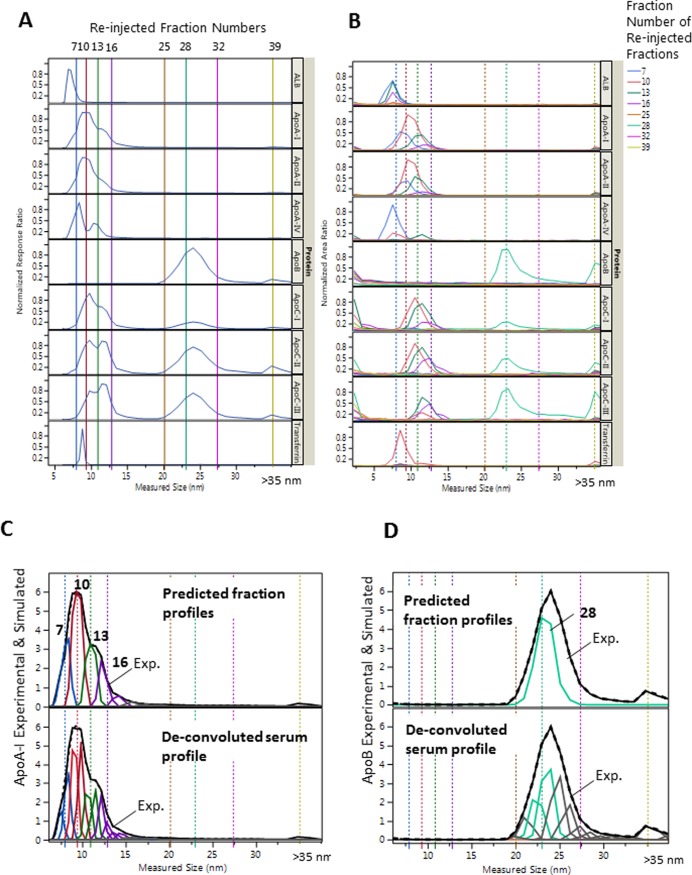
Fig 4. Size profiles from serum and corresponding fractions.
A: Size profile of representative proteins from serum (50 μL injection volume). B: Size profile from re-injected AF4 fractions indicated by colors (200 μL injection volume). C: De-convolution of the apoA-I profile in A (bottom) and predicted fraction profiles (top). D: De-convolution of the apoB profile in A (bottom) and predicted fraction profiles (top), generated by summing together de-convoluted Gaussian peaks. Re-injected fractions are indicated by numbers on the top and by the colors of solid vertical lines in A, matched with the color of the overlaid size profiles in B. The dotted vertical lines in B correspond with lines in A. The colors of the predicted profiles in C and D matched with the colors of the size profiles of the fractions for apoA-I and apoB in B.

