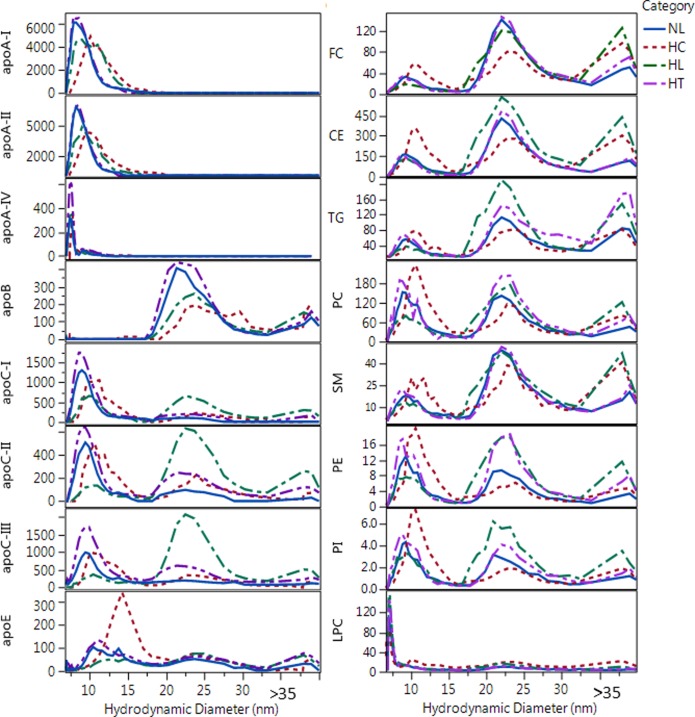
Fig 6. Overlay of size distribution profiles of apolipoproteins and lipids for representative samples from different categories.
Labels indicate normolipidemic (NL, Total-C = 206 mg/dL and Total-TG = 130 mg/dL), hypercholesterolemic (HC, Total-C = 249 mg/dL and Total-TG = 121 mg/dL); hyperlipidemic (HL, Total-C = 287 mg/dL and Total-TG = 180 mg/dL); and hypertriglyceridemic (HT, Total-C = 212 mg/dL and Total-TG = 188 mg/dL). Y axis for apolipoprotein concentrations are in nM and for lipids are in μM units.

