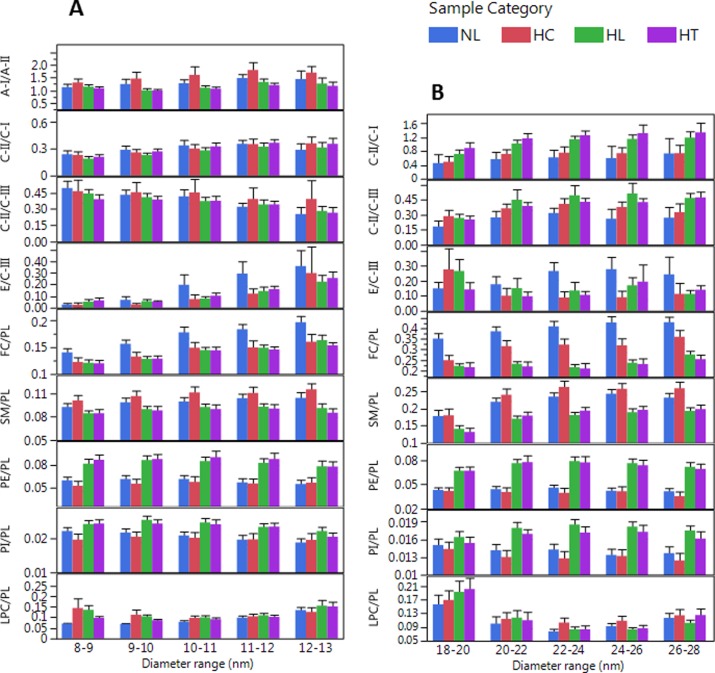
Fig 12. Analyte ratios in size ranges that most characterize sample categories.
Error bars indicate confidence intervals (biological variability in sample categories); HDL size region (A), non-HDL size region (B). Labels indicate normolipidemic (NL, N = 25, Total-C <230 mg/dL, and Total-TG <150 mg/dL); hypercholesterolemic (HC, N = 13, Total-C >230 mg/dL and Total-TG <150 mg/dL); hyperlipidemic (HL, N = 41, Total-C >230 mg/dL and Total-TG >150 mg/dL); and hypertriglyceridemic (HT, N = 31, Total-C<230 mg/dL and Total-TG>150 mg/dL).Error bars indicate 95% confidence intervals.

