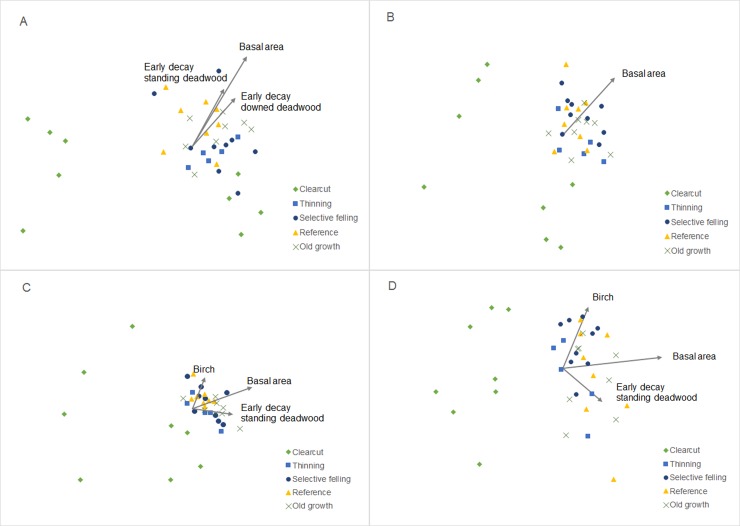
Fig 4. NMDS plots.
NMDS plots showing the effect of stand type on beetle assemblages for the four different data sets: A) bolts (stress = 0.15), B) window traps (stress = 0.11), C) early early successional species (stress = 0.12) (decay class preference below 3; dead wood still hard) and D) late successional species (decay class preference 3 and above; wood has started to soften) (stress = 0.15). Data were square root transformed with Bray-Curtis distances and were run with 20 random starts to find a stable final solution. The fitted stand variables with a significant correlation are included.

