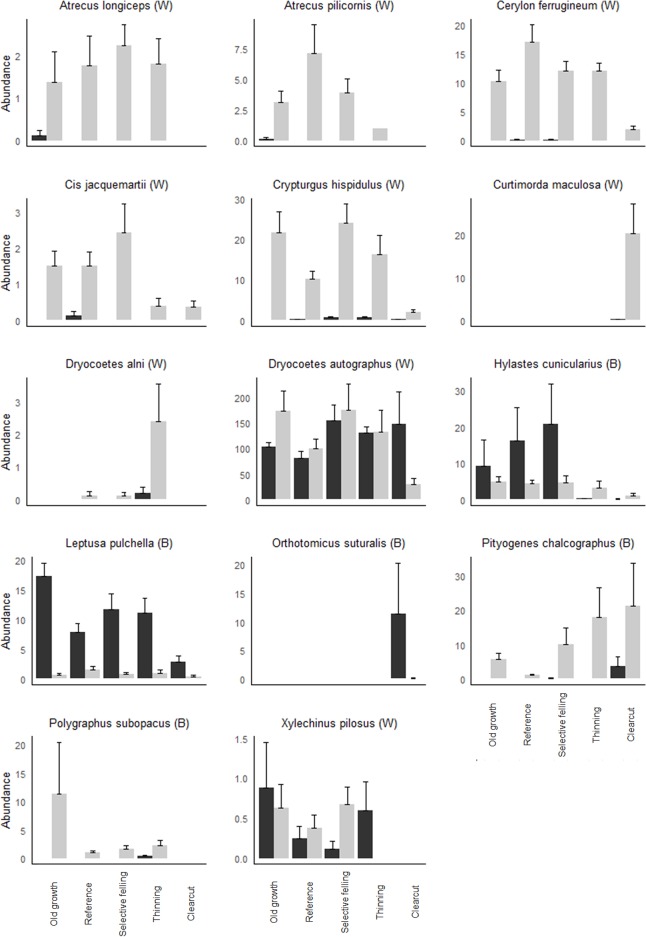
Fig 5. Species with significant treatment effects.
Mean ± abundance by management strategy among management strategies for species captured using bolts (black bars, marked with a B if significant) and window traps (grey bars, marked with W if significant). Only species that differed significantly are shown, but results from both trapping methods are always shown. Note the variable scale on the y-axis.

