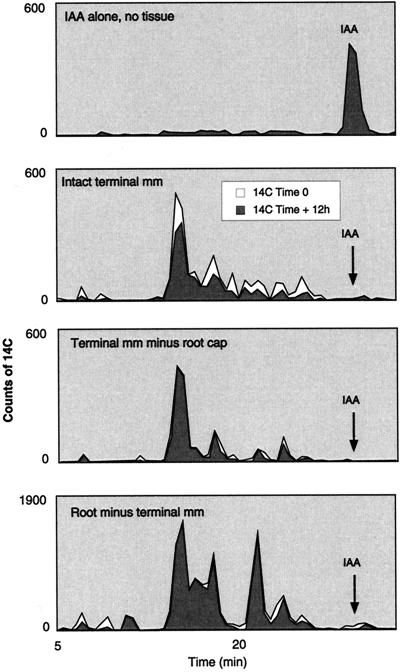
Figure 8.
HPLC elution profiles of 1-14C-IAA metabolites in various maize root tissues. Black portions for each curve represent the actual recoverable 14C counts in each fraction after a 12-h incubation. The white portions under the curve represent the 14C counts that would have been recovered had there not been any decarboxylation. To determine which fractions show decarboxylation, 1-14C- and 5-3H-IAA in a known ratio were together incubated with root tissues. At the end of the 12-h incubation period the ratios of 14C- and 3H-IAA were compared for each fraction and the curve normalized for any change in the ratio (indicating a loss of 14C) (white portion of the curve). The only significant changes in the ratio are in IAA metabolites in intact terminal millimeter root tissues. For all other treatments the ratios are more or less unchanged and the white and black curves overlap. Note that all root tissues completely catabolize the radiolabeled IAA.

