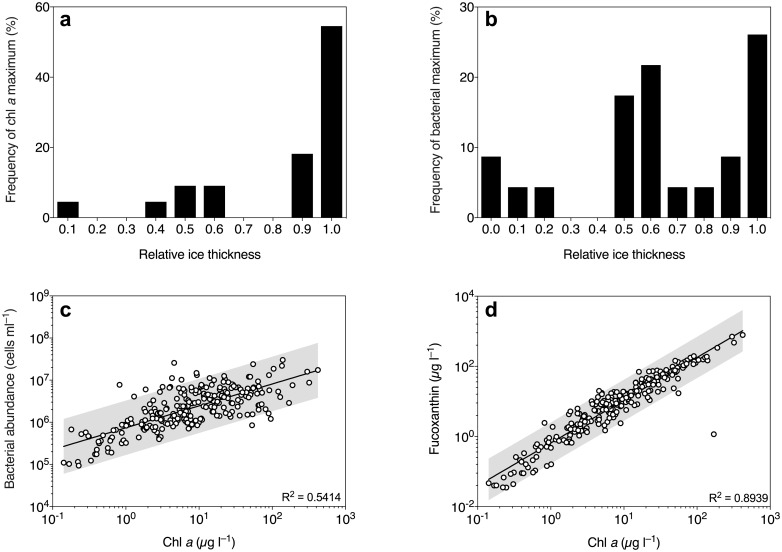
Fig 2. Biomass distribution in Southern Ocean sea ice during summer.
Frequency distribution of the chl a (a) and bacterial abundance (b) maxima at different relative ice thicknesses (binned in 10% increments). Correlation between bacterial abundance and chl a concentration in the sea-ice samples (c). Correlation between chl a and fucoxanthin concentration (d). Concentrations are scaled to brine volume and the grey areas represent 95% prediction interval of the fitted line.

