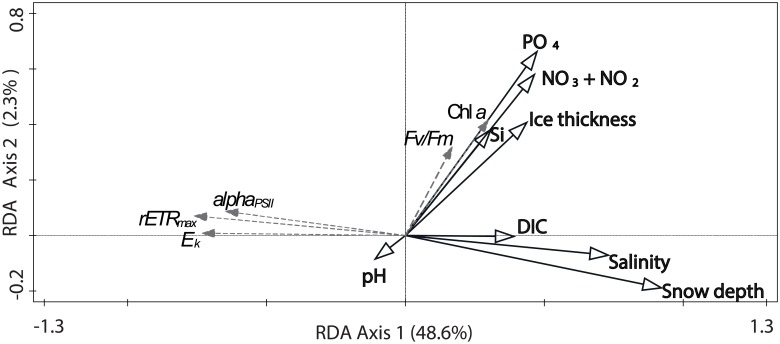
Fig 5. RDA ordination plot of environmental variables (black solid lines) explaining photophysiological data (grey, dashed lines).
The first two RDA axes were significant (pseudo-F = 13.4, p = 0.001, 1000 permutations in Monte Carlo permutation test) and account for 51.0% of the total variation in the dataset. The environmental variables are inorganic macronutrient concentrations (nitrite + nitrate (NO2 + NO3), phosphate (PO4), silicic acid (Si)), brine salinity, dissolved inorganic carbon (DIC), pH, snow depth, sampling depth (ice thickness). Photophysiological data include Fv/Fm, rETRmax, Ek, αPSII (alphaPSII) and brine-scaled chl a concentration.

