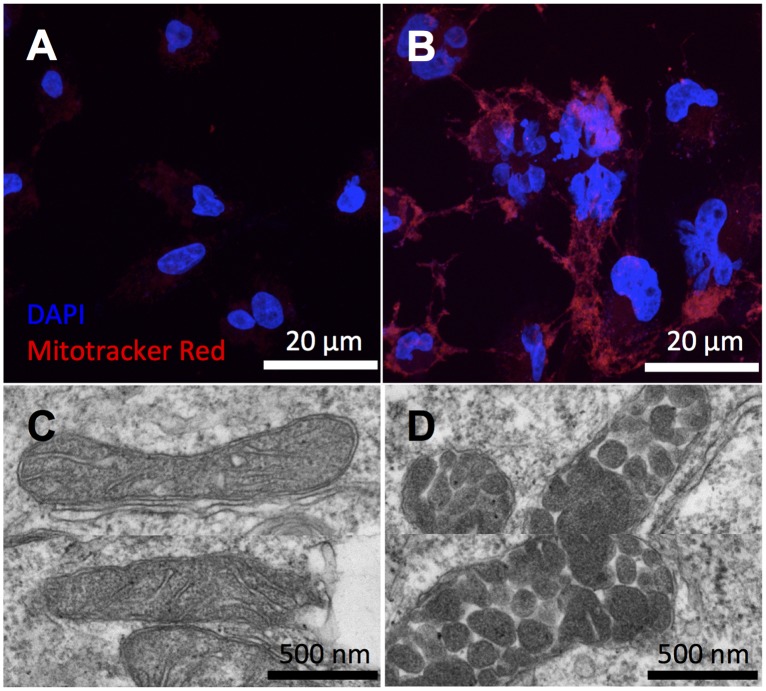
Fig 5. Imaging mitochondrial dysfunction in CPT1AKD cells.
(A, B) Mitochondria were stained by Mitotracker red, and nuclei were stained by DAPI. Images from scrambled small interfering RNA (siRNA) controls (A) show less fluorescence intensity of Mitotracker red compared to CPT1AKD cells (B). (C, D) Representative electron microscopy (EM) images of normal mitochondria in wild-type BT549 cells (C) and the abnormal vesicular morphology of mitochondria in CPT1AKD cells (D).

