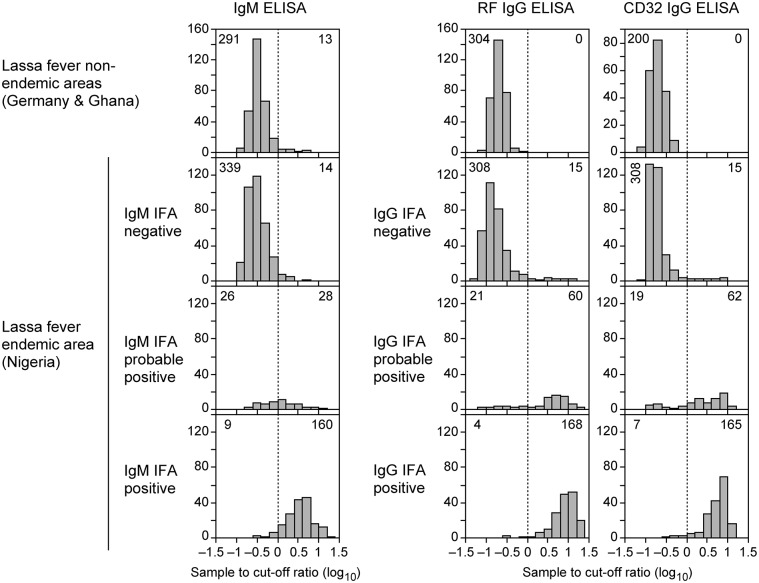
Fig 1. Sample-to-cut-off (S/CO) values for 880 sera tested in IgM ELISA, RF-based IgG ELISA, and CD32-based IgG ELISA and comparison with IFA results.
The S/CO values obtained with the ELISA are shown as histograms according to sample origin, type of ELISA, and IFA results. The cut-offs for the ELISAs are indicated by vertical dotted lines. The number of samples with OD < CO and OD > CO is indicated in left and right corner, respectively, of each diagram.

