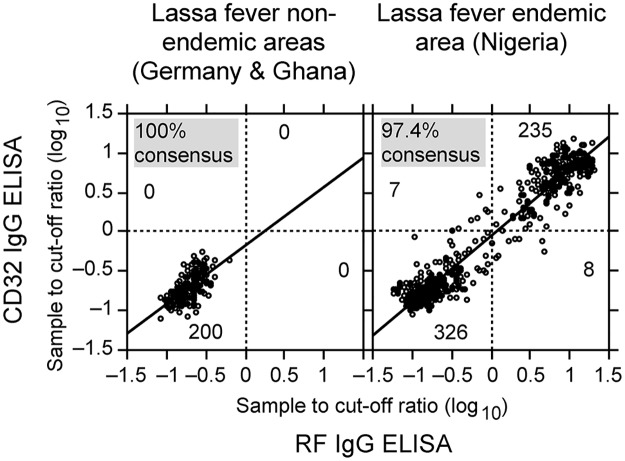
Fig 2. Comparison of RF- and CD32-based IgG ELISA results obtained from 776 sera.
The S/CO values obtained with the RF ELISA were plotted against the S/CO values of the CD32 ELISA. The cut-offs for both assays are indicated by horizontal and vertical dotted lines. The number of samples per quadrant is also given. The regression curve is shown as straight line. Samples from Lassa fever non-endemic and endemic countries were plotted separately.

