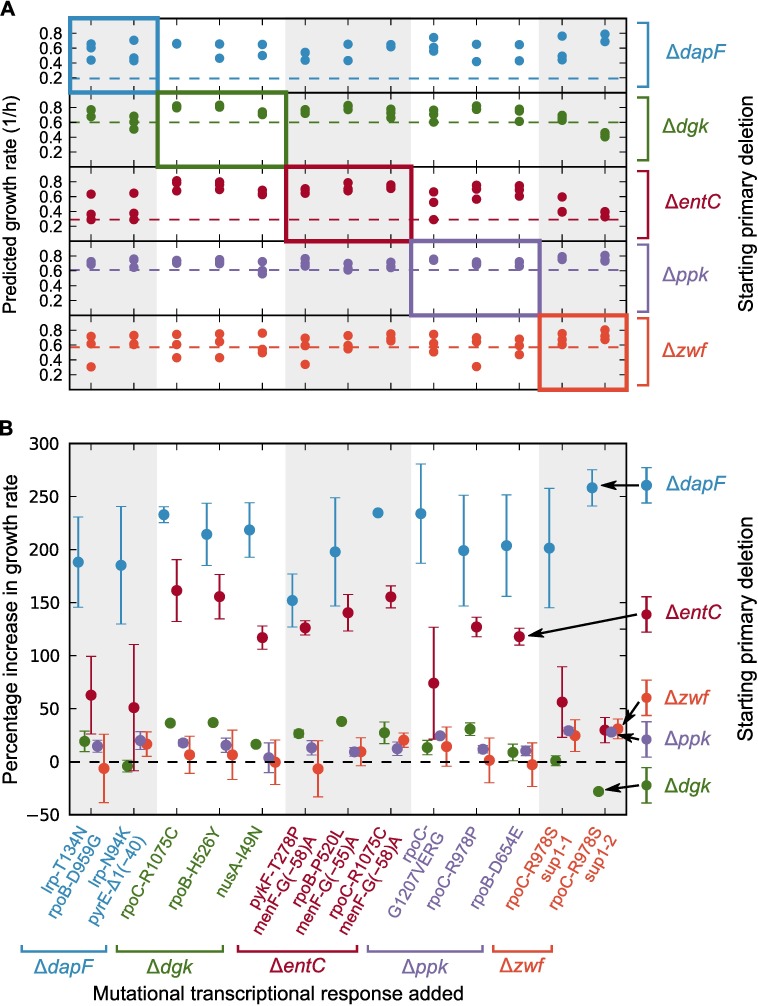
Fig 8. Predicted growth effects of sup mutations in all alternative deletion backgrounds.
(A) Predicted growth rates for expression profiles constructed by adding each of n = 3 replicate of the primary deletion (right color code) to each mutational transcriptional response (color coded at the bottom by the primary deletion). Dashed lines indicate the measured growth rates of the deletion strains. Note that points in the highlighted diagonal blocks lie above the dashed lines indicating the consistency with which mutations rescue growth in the primary deletion background in which they were selected. (B) Mean predicted percent increase over the growth rate of the measured deletion strain (right color code) when the mutational transcriptional response (bottom color code) is added. The dashed line demarcates the boundary between beneficial and deleterious mutational effects. Error bars standard error of the mean over the replicates, and each starting strain is shifted horizontally by the width of a dot for visibility.

