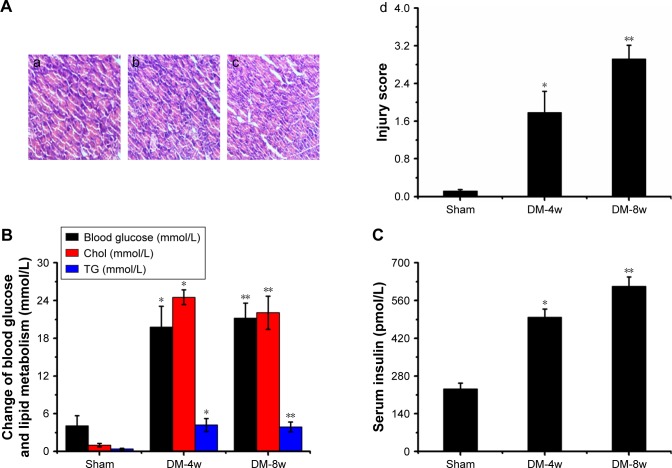
Figure 5.
(A) Histopathologic assessment of myocardial damage; (B) blood glucose, Chol, and TG levels; (C) serum insulin level.
Notes: (A) Light microscope images (×100) in Sham group (a), DM-4w group (b), and DM-8w group (c). The quantitative analysis of histopathologic assessment is shown in “d”. Results are expressed as mean ± SD. A significant increase from Sham group is denoted by *p<0.01, and a significant increase from DW-4w group is denoted by **p<0.01. (B) The blood of Sham, DM-4w, and DM-8w groups were collected, and the levels of blood glucose, Chol, and TG were measured. Results are expressed as mean ± SD. A significant increase from Sham group is denoted by *p<0.01, and a significant increase from DW-4w group is denoted by **p<0.01. (C) The blood of Sham, DM-4w, and DM-8w groups were collected and the levels of serum insulin were measured. Results are expressed as mean ± SD. A significant increase from Sham group is denoted by *p<0.01, and a significant increase from DW-4w groups is denoted by **p<0.01.
Abbreviations: DM, diabetes mellitus; Chol, cholesterol; TG, triglyceride; SD, standard deviation.

