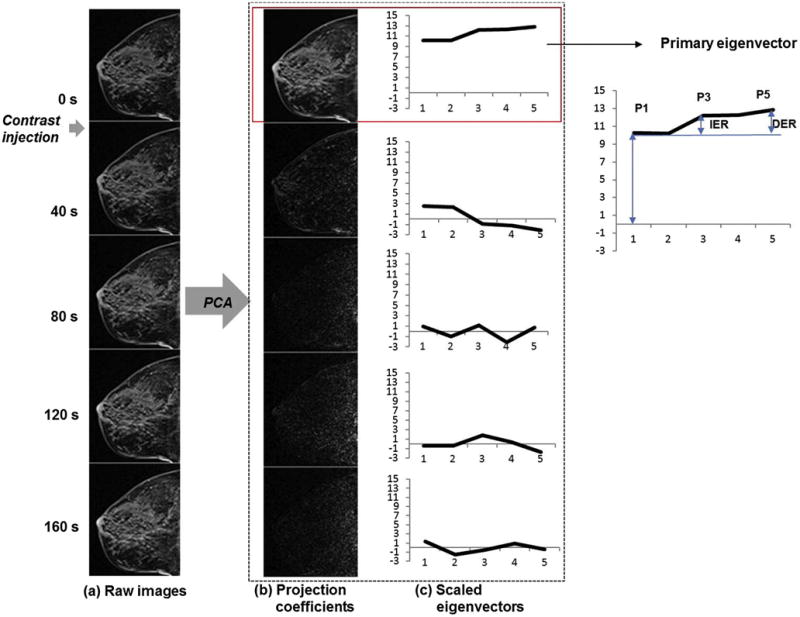
Figure 1.

Representative example of the PCA-based analysis of DCE-MRI data. (a) Fat-suppressed T1-weighted images with contrast injection during the second image. Signal intensity range was kept constant to show the contrast enhancement. (b) Projection coefficient maps of the principal components in the descending order of eigenvalues. (c) The principal components used to compute the projection coefficient maps shown in (b). Plotted are the eigenvectors scaled so that the sum of their squares are equal to the corresponding eigenvalues.
