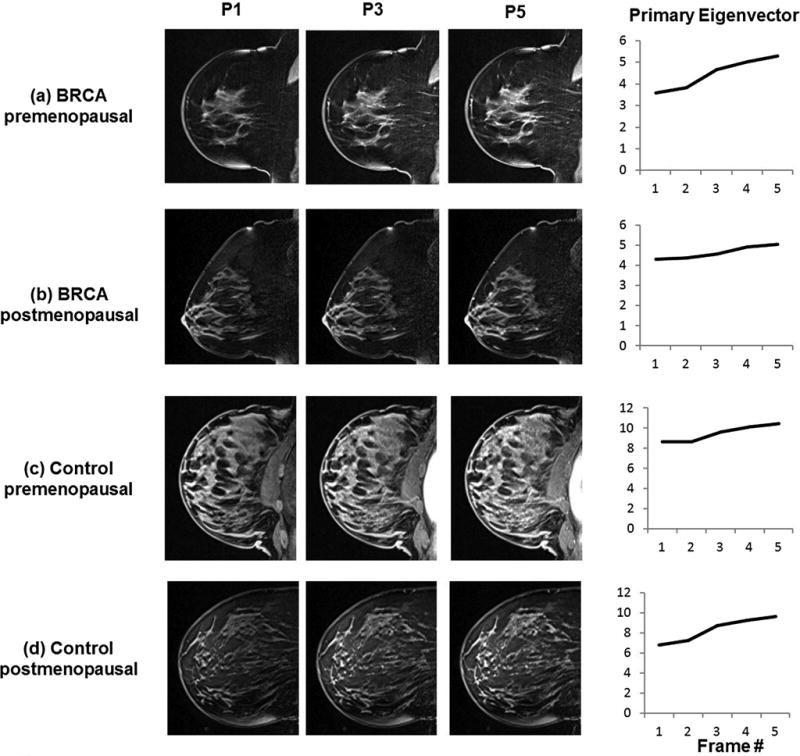
Figure 2.

Representative examples of the DCE images at 3 time points used to measure IER and DER for (a) BRCA premenopausal case, (b) BRCA postmenopausal case, (c) control premenopausal case, and (d) control postmenopausal case. The corresponding scaled primary eigenvectors are shown for each case to demonstrate how the eigenvectors represent background parenchymal enhancement.
