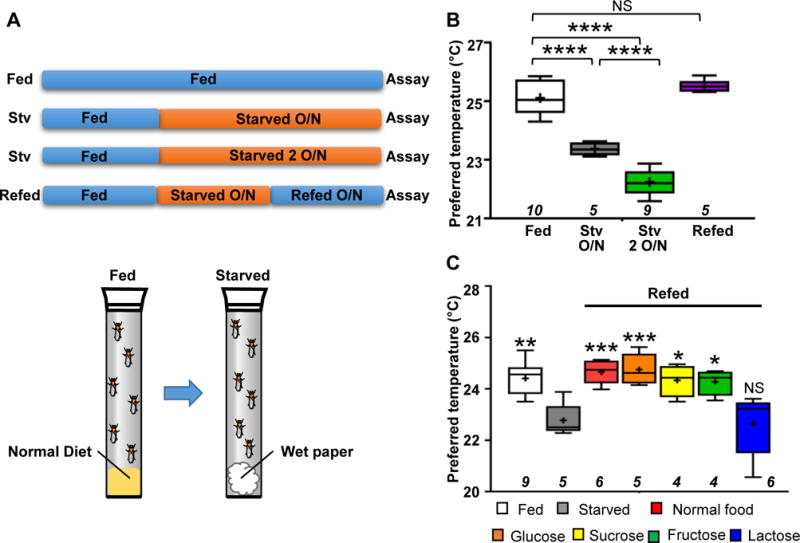
Figure 1. Starvation causes a lower preferred temperature (Tp).

(A) A schematic diagram of the experimental conditions. The flies were reared under normal food conditions (Fed; blue-colored bars), then transferred to starved conditions (water-soaked paper) for either 18–21 hr (overnight (1 O/N)) or 42–45 hr (2 O/N) (starved; orange-colored bars) and tested in behavioral assays for temperature preference. The flies starved for 24 hr were refed overnight (Refed 1 O/N). The details are provided in the experimental procedures.
(B) Comparison of Tp among fed (white box), starved overnight (gray box), starved 2 O/N (green box) and refed (purple box) conditions in w1118 (control) flies. The behavioral experiments were performed at Zeitgeber time (ZT) 4–7. The behavioral experiments performed at ZT 1–3, 4–6, 7–9 and 10–12 are shown in Figure S1B (Fed: blue line, Starved: orange line). Whiskers indicate the minimum-maximum data range of Tp, and boxes indicate the 25–75th percentile data range of Tp. A horizontal line and a cross in each box represent the median and mean, respectively. Italicized numbers indicate the number of trials. One-way ANOVA followed by a post hoc Dunnett’s test was performed to compare each Tp to the control (fed condition). **p<0.01. NS indicates no significance.
(C) Comparison of Tp among flies that were normally fed (white box), starved overnight (gray box), refed with normal food (red box) and refed with the following sugar solutions: Glucose, 1% glucose (orange box); Sucrose, 1% sucrose (yellow box); Fructose, 1% fructose (green box); and Lactose, 1% lactose (blue box). The behavioral experiments were performed at ZT 1–3. The plotting pattern is the same as in Figure 1B. One-way ANOVA and post hoc Dunnett’s test was performed to compare Tp under each condition to starved conditions (gray box). *p<0.05. **p<0.01. ***p<0.001. NS indicates no significance. See also Figure S1 and Table S2.
