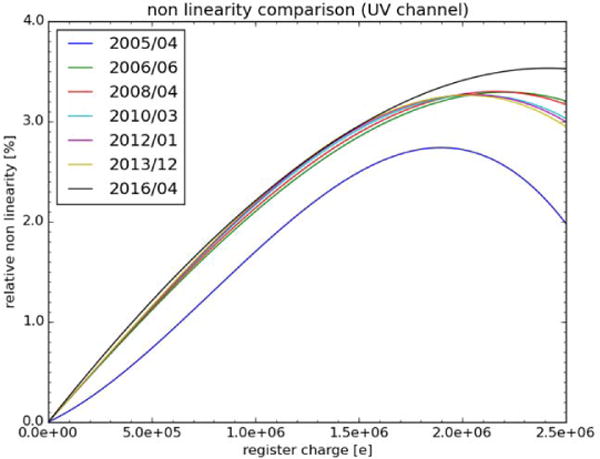
Figure 11.

Non linearity comparison for the UV channel, for different years. Apart from the 2005/04 curve, the curves are pretty similar which indicates that non linearity has not changed much during the mission. The curves for the VIS channel are similar to the UV channel curves.
