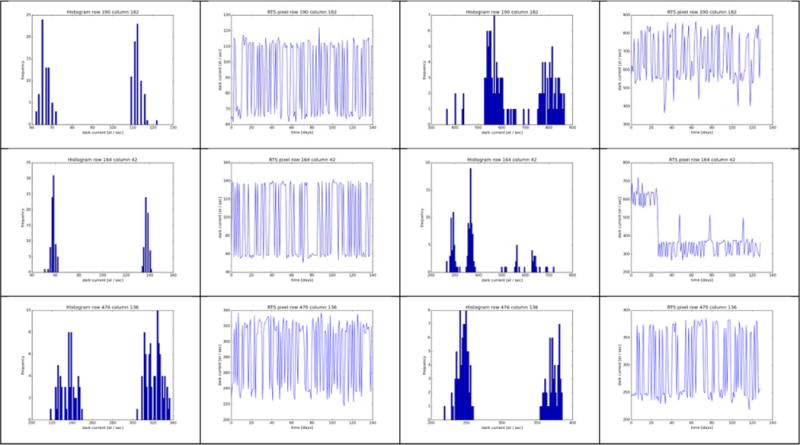
Figure 14.

Examples of RTS pixels. Left two columns show results for 2008, right two columns show results for 2015. First and third column show histograms of RTS pixels. Second and fourth column show dark current evolution over time. In 2015 the dark current and noise are higher, which gives the histograms a smoother character. Note the different scales that are used for 2008 and 2015.
