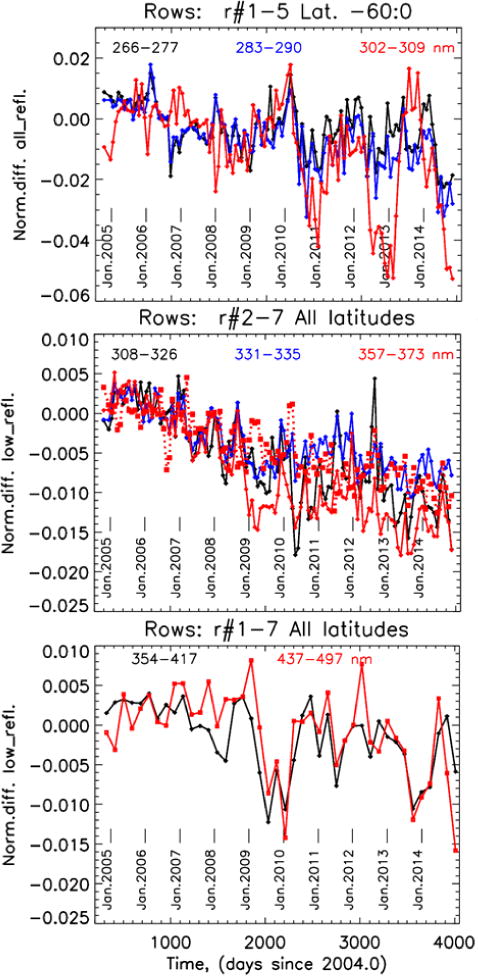
Figure 29.

Top panel: the de-trended, normalized time-, wavelength-, latitude- and row-binned UV1 radiances. Central panel: the same for UV2 for the low-reflectivity (<10%) subsample (full red line) and the high-reflectivity (>80%) data (dotted red line) for the 357–373 nm range. Bottom panel: the low-reflectivity, binned radiance trends for VIS. Note the change of the y-axis plotting scales for different OMI channels.
