Figure 3.
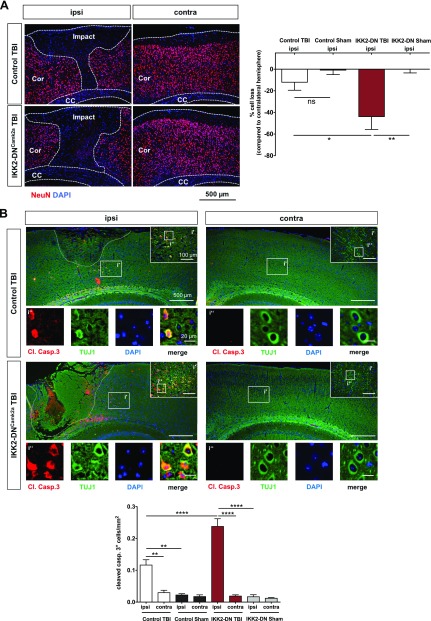
IKK2-DNCamk2a mice exhibit prominent neuronal apoptosis after CHI. A) Neuronal cell loss 3 d after CHI. Significantly enhanced neuronal cell loss in the ipsilateral cortex of IKK2-DNCamk2a mice compared with control TBI and sham-treated mice. Immunofluorescent staining and quantification of NeuN+ cells. The percentage of neuronal cell loss was calculated as the ratio of neuronal cells from the injured (ipsilateral) hemisphere to the number of neurons in the uninjured (contralateral) hemisphere. Impact, TBI impact area; Cor, cortex; CC, corpus callosum. Means ± sem (n = 4–5). *P < 0.05, **P < 0.01 (by 1-way ANOVA with Bonferroni’s correction). Scale bar, 500 µm. B) Apoptotic neurons 3 d after CHI. Increased posttraumatic neuronal cell death 3 d after TBI in the injured (ipsi) hemisphere of IKK2-DNCamk2a mice vs. control TBI and sham-treated animals and vs. the uninjured (contra) hemisphere. Coimmunostaining of the apoptotic marker cleaved caspase 3 (Cl. Casp.3) and the neuronal marker TUJ1. Quantification of cleaved caspase 3+ cells revealed significantly enhanced apoptosis in mice with neuronal NF-κB inhibition vs. control animals. Means ± sem (Control TBI, n = 4; Control Sham, n = 2; IKK2-DNCamk2a TBI, n = 4, IKK2-DNCamk2a Sham, n = 2). **P < 0.01, ****P < 0.0001 (according to 1-way ANOVA with Bonferroni’s correction). Scale bar, 500 µm; i′, inset′: 100 µm; i″, inset″: 20 µm.

