Figure 1.
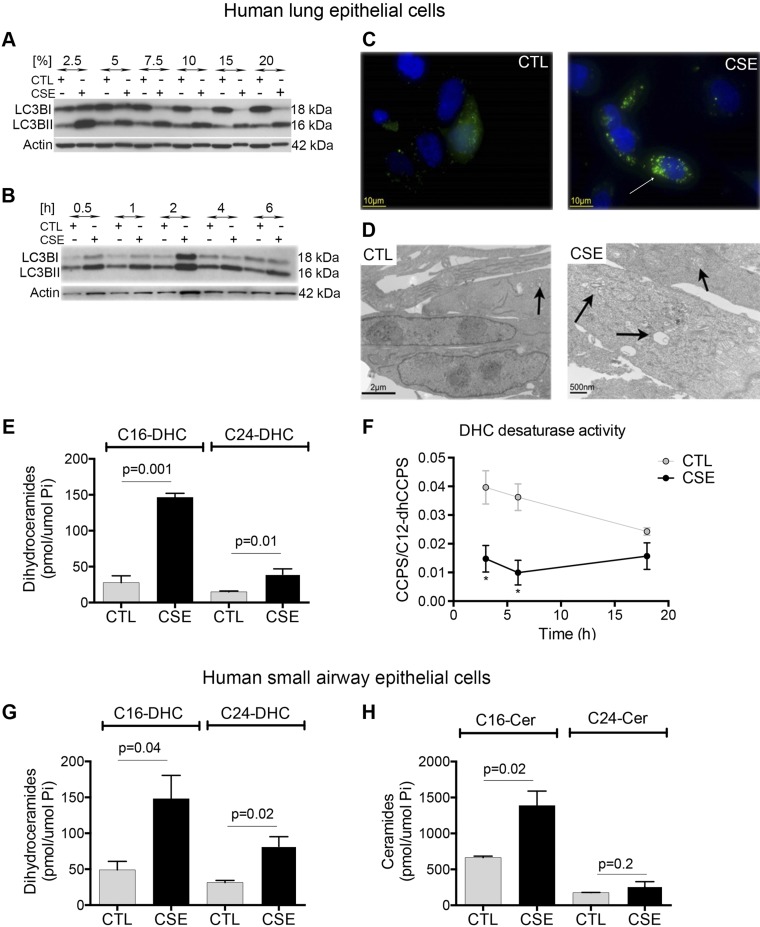
Effect of CS exposure on autophagy and Cer in lung epithelial cells. A, B) Immunoblot analysis of LC3BII, with β-actin as a loading control in Beas-2B cells exposed to ambient air control (ctl) or CS extract (CSE) at the indicated concentrations (5%; A), or for the indicated time (6 h; B). C) Representative immunofluorescence images (n = 3) of Beas-2B cells transiently transfected with eGFP-LC3B plasmid and then exposed to ctl or CSE (5% for 6 h). DAPI staining (blue) indicates nuclei. Note LC3B staining (green) in a cytosolic-diffuse pattern in ctl cells compared with bright-green puncta (arrow) in CSE-exposed cells. D) Representative electron microscopy images (n = 2) of Beas-2B cells exposed to CSE (5% for 6 h). Scant autolysosomes (arrow) were noted in ctl, whereas multiple structures with double-limiting membranes (autophagosomes and autolysosomes) can be seen CSE-exposed cells (arrows). E) C16- and C24-DHC species abundance in Beas-2B cells exposed ctl or CSE (5% for 6 h). F) DEGS activity in Beas-2B cells exposed to ctl or CSE (5%, indicated time), measured by the rate of conversion of C12-dhCCPS to C12-CCPS; *P < 0.05. G, H) C16- and C24-DHC (G) and C16- and C24-Cer (H) abundance in primary human SAECs exposed to ctl or CSE (5% for 6 h; n = 3). All graphs are means ± sem; 2-way ANOVA with Holm-Sidak post hoc analysis.

