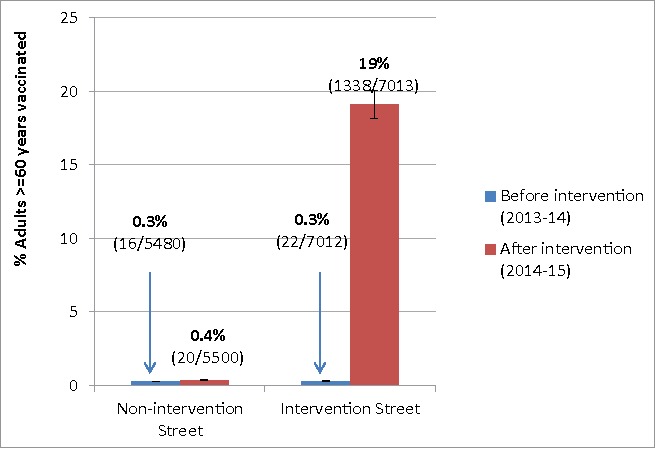
Figure 1.

Seasonal influenza vaccine coverage among older adults on both the intervention and control streets, pre- and post- intervention, Ningbo, 2013–2015. This figure shows the comparison of seasonal influenza vaccine coverage among older adults ≥ 60 years on both the intervention street and the control street in two time frames, pre-intervention and post-intervention. The blue bars show vaccine coverage before the intervention on both streets. The red bars show the seasonal influenza vaccine coverage after the intervention on both streets. The 95% Confidence Intervals for the vaccine coverage are displayed with error bars.
