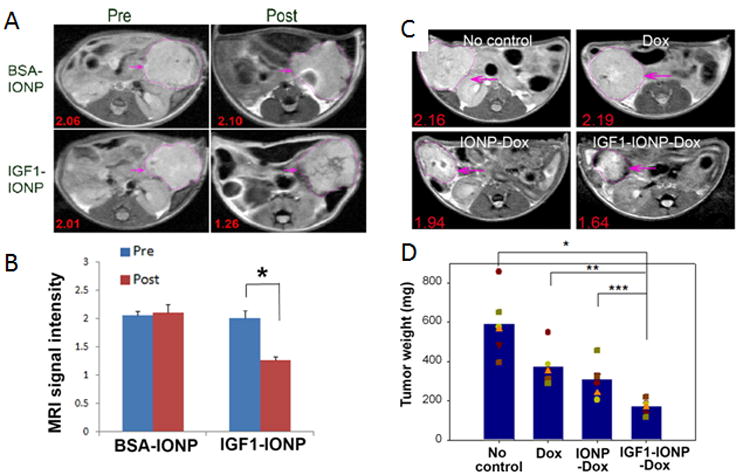
Figure 4.

Detection of targeted delivery of IGF1-IONPs by MRI and in vivo antitumor effect in an orthotopic pancreatic PDX tumor model. (A) Pre and post injection T2-weighted MR images with relative mean MRI signal intensities of the entire tumor. (B) Bar figure shows quantification of MRI signals in the tumor pre- and post injection of IONPs. Relative MRI signal was defined as the mean intensity of the tumor divided by the mean intensity of the muscle. *p < 0.0001. (C) T2-weighted MRI of treated mice confirmed the accumulation of IGF1-IONP-Dox in the tumor and tumor growth inhibition compared to both free Dox- and non-targeted IONP-Dox-treated tumors. Red numbers show the mean of relative MRI signal intensities of MRI image slices from the entire tumor. A 10.2% MRI signal decrease was detected in non-targeted IONP-Dox-treated tumor, while a 24.1% MRI signal decrease was seen in IGF1-IONP-Dox-treated tumor. (D) Tumor growth inhibition. The mean tumor weight (navy bar) and individual tumor weight distributions as color symbols after the treatment are shown. *p < 0.0001; **p < 0.0006; ***p < 0.005. Pink arrows indicate the location of pancreatic PDX-tumor lesions. Adapted with permission from 20.
