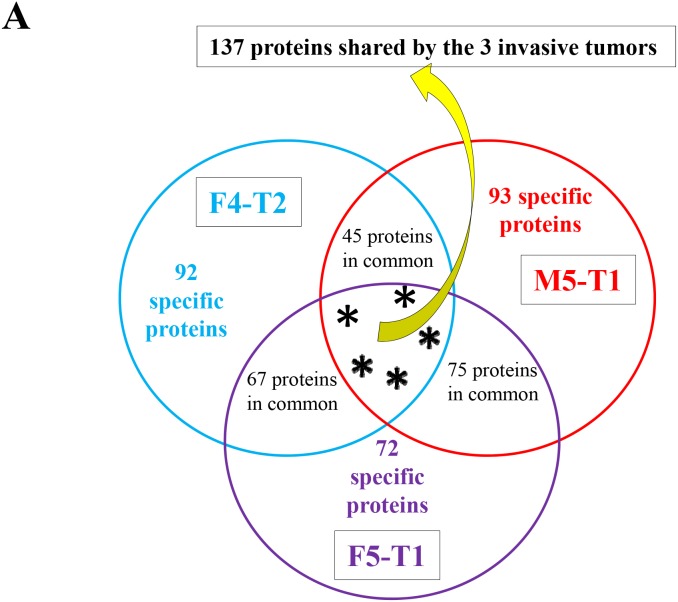
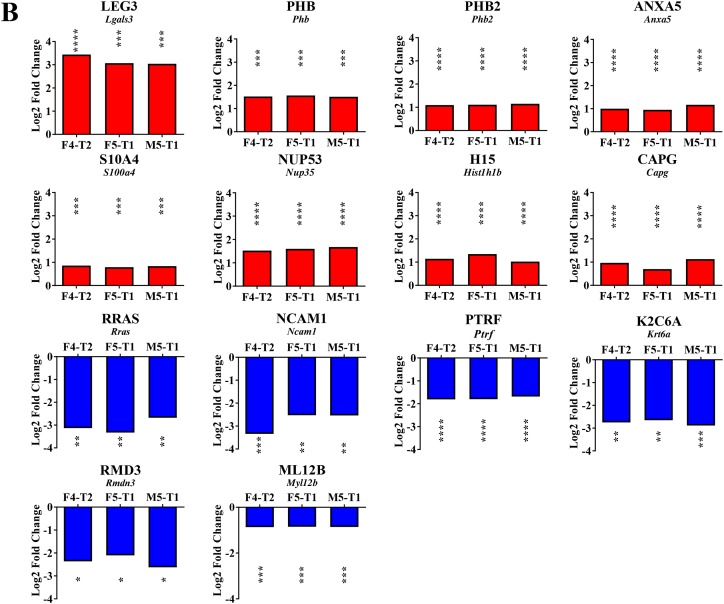
Figure 3. Proteins associated with the acquisition of invasive properties.
(A), Schematic representation of the number of proteins analyzed in the comparison between the invasive tumors, F4-T2, F5-T1 and M5-T1 (M5-T2 noninvasive tumor as the reference). (B), Quantitative changes of the same order of magnitude shared by the three invasive tumors (main proteins from the list of 137 indicated in (A) and described in Table S2, restricted to p values < 0.05 for both MSstats and MarkerView statistical analyses). Log2FC on the bar graphs correspond to the Log2 fold change observed between the three invasive tumors relative to the noninvasive tumor M5-T2. Log2FC are given for the MSstats analysis together with the corresponding p values (*0.01 < p < 0.05; **0.001 < p < 0.01; ***0.0001 < p < 0.001; ****p < 0.0001).


