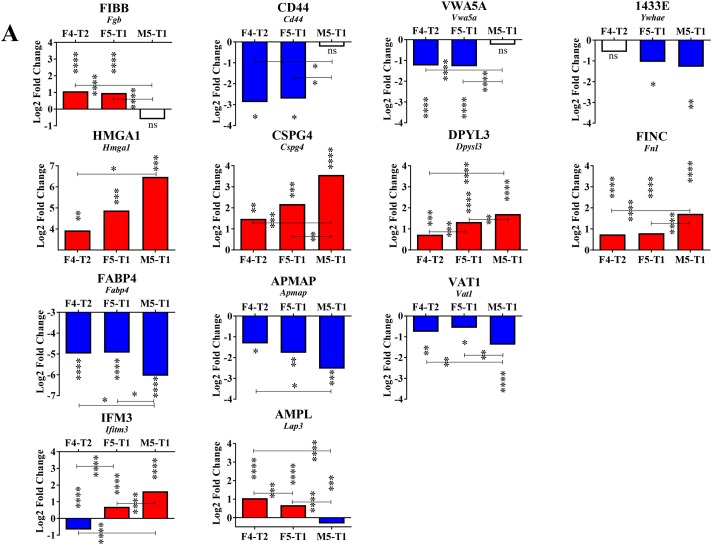
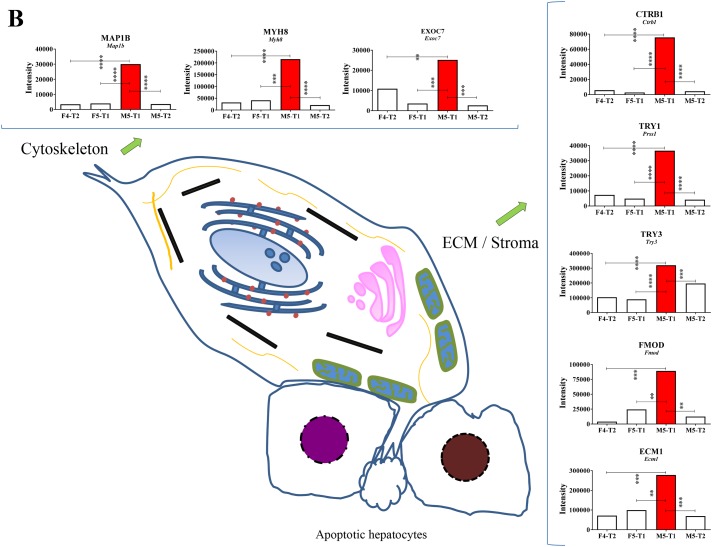
Figure 5. Specificities of the M5-T1 tumor.
(A), Maximum changes (decrease or increase relative to the F4-T2 and F5-T1 tumors) observed specifically in the M5-T1 tumor. Log2FC corresponds to the Log2 fold change observed between the invasive tumors in comparison with the noninvasive tumor M5-T2 (MSstats analysis, same representation as in Figures 3B and 4A). Asterisks at the top of the bars correspond to the significance of the differences observed in comparison with the noninvasive M5-T2 tumor. When significant differences were also observed between the three invasive tumors, p values were also indicated. (B), Schematic representation of the most aggressive M5-T1 tumor, with comparative intensities (MarkerView statistical analysis) of the proteins concerned with the most significant changes (from the list of 93 proteins exhibiting significant quantitative changes only found in the M5-T1 tumor in comparison with the noninvasive tumor M5-T2, as indicated in Figure 3A).


