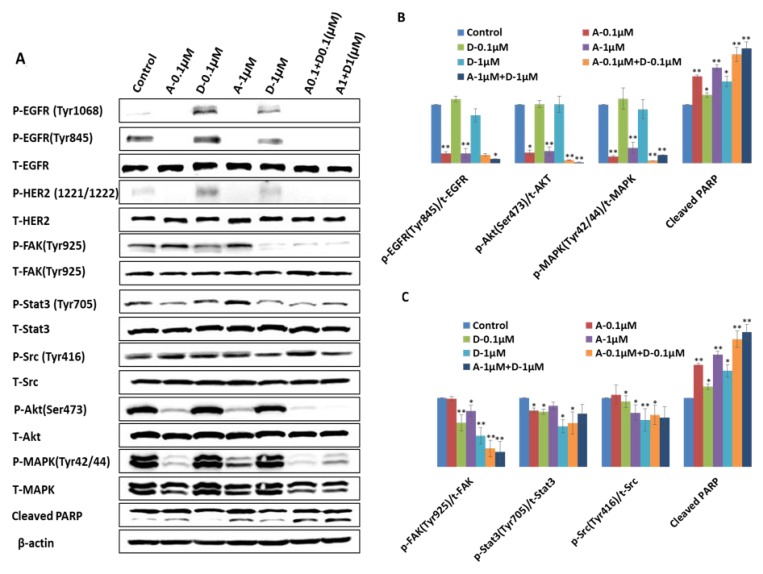
Figure 4. Different effect of afatinib, dasatinib and their combination on the targeted proteins and downstream molecules in H1650 cells.
(A) Western blot analysis showed different expression level of the targeted proteins and downstream molecules upon the designated treatments. For example, A-0.1 µM indicates the treatment of afatinib at the dosage of 0.1 µM, and A0.1 + D0.1 (µM) means the combination of 0.1µM of afatinib and 0.1 µM of dasatinib. (B, C) Quantification of the ratio of phosphorylated protein to total protein by ImageJ software. The results were mean ± SD obtained from at least three experiments. P-value was calculated by student’s t test (**p < 0.01; *p < 0.05).

