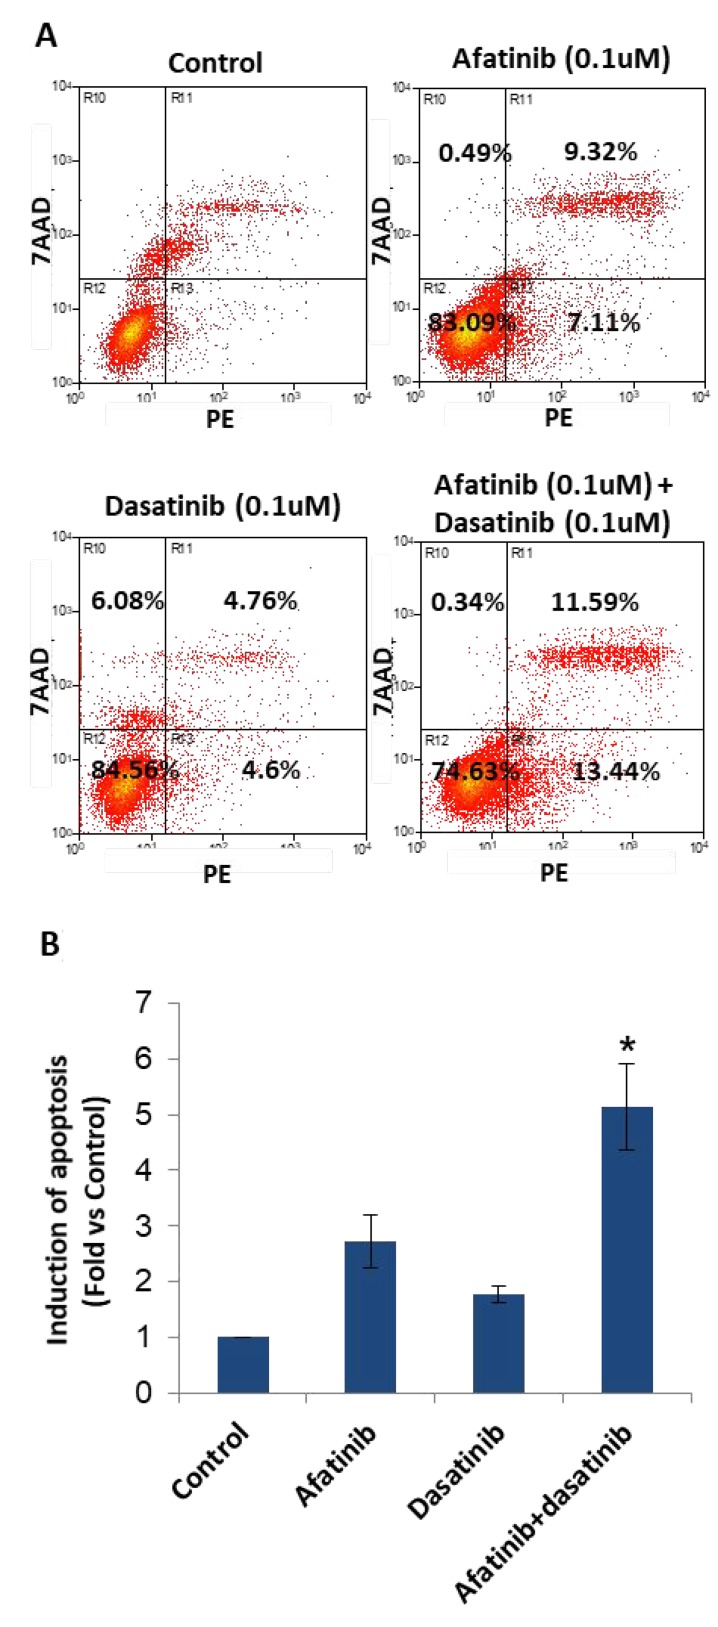
Figure 5. Induction of apoptosis by the treatment of afatinib, dasatinib, and their combination in H1650 cells.
(A) Flow cytometry analysis showed the induction of apoptosis upon the designated treatment. (B) Statistic chart showed the significant induction of apoptosis by the combination of afatinib and dasatinib comparing with afatinib or dasatinib alone. The results were mean ± SD obtained from at least three experiments. P-value was calculated by student’s t test (*p < 0.05).

