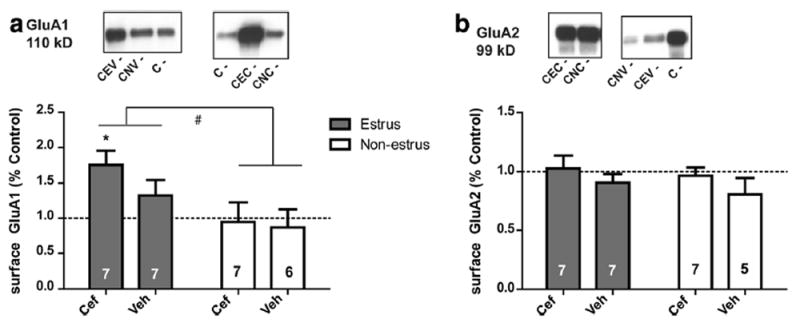
Fig. 4.

Surface protein expression levels of GluA1 and GluA2 in the NAc of females. Protein expression was expressed as percent of the Control group. a Surface expression levels of GluA1 were significantly increased for females in estrus. b Surface expression levels of GluA2 did not differ due to Phase or Treatment. Closed bars denote females in estrus and open bars denote females in non-estrus phases. Panel a Controls n = 9, mean = 1.0 ± 0.15; Panel b Controls n = 13, mean = 1.0 ± 0.07. # = p < 0.05 for estrus compared to non-estrus
