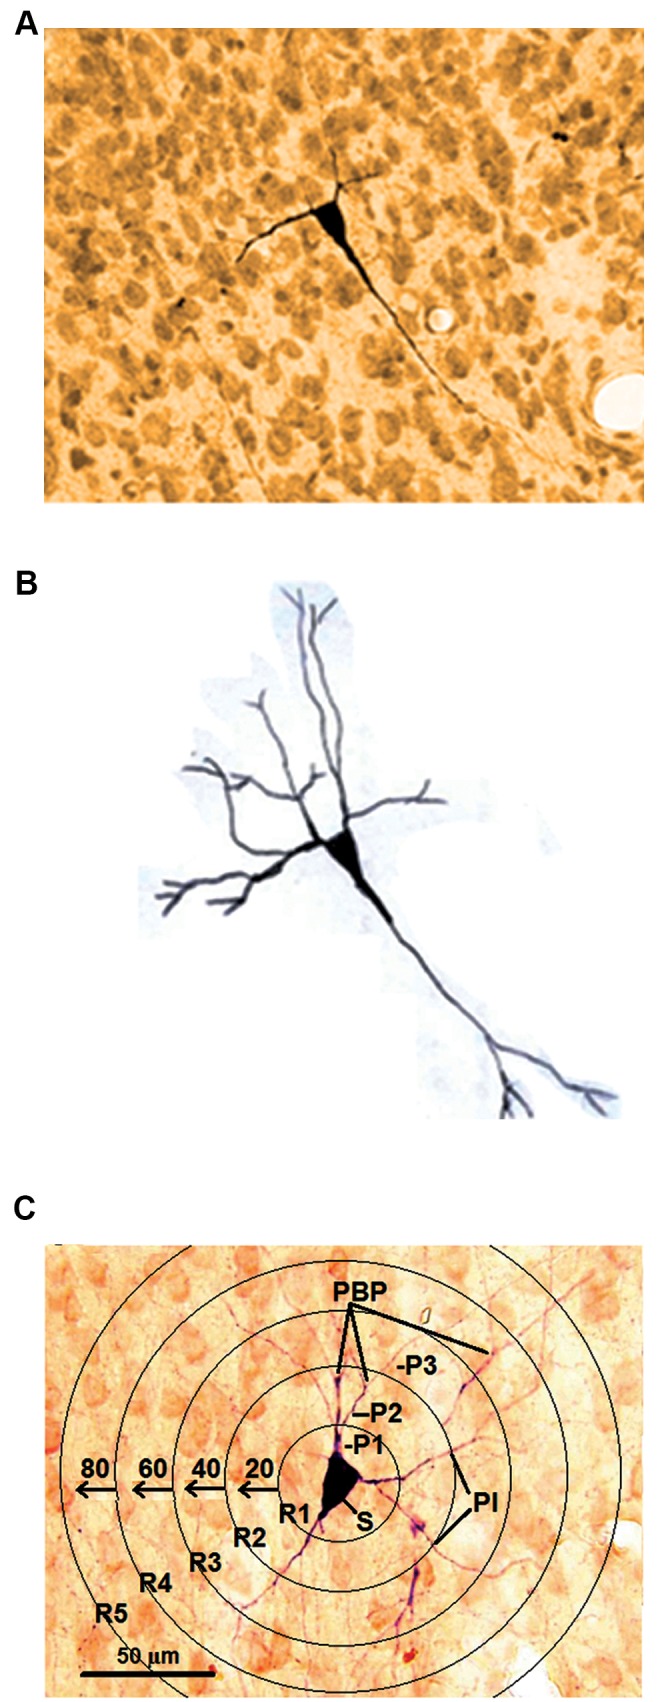
Fig.2.

The processes quantification in a NADPH-d labeled neuron. A. Photomicrograph of a NADPH-d labeled neuron, B. Camera lucida tracing of a NADPH-d labeled neurons which is depicted in part A, and C. The processes quantification for a NADPH-d labeled neuron in the concentric rings according to Sholl analysis.
R; Rings, P1-3; Processes per 1st, 2nd and 3rd orders, PB-P; Processes branching points, PI; Processes intersections, and S; Soma.
