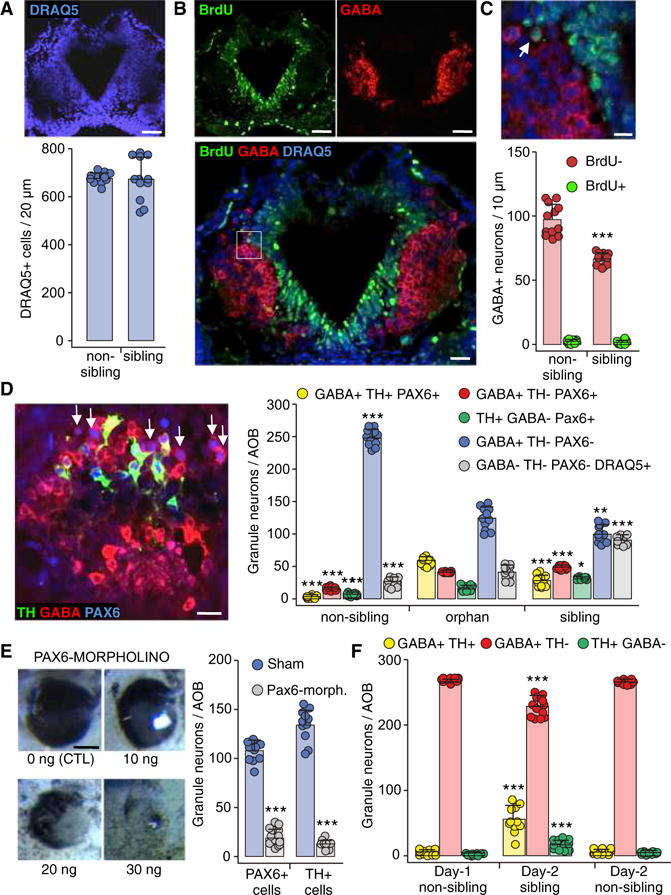
Figure 2. Neurotransmitter Switching between Sibling and Non-sibling Conditions Occurs within a PAX6+ Reserve Pool.

(A) The total number of AOB cells does not change across raising conditions. Horizontal section through the middle of the AOB (stage 44) labeled for DRAQ5. Quantification of DRAQ5+ cells/20 μm section. Scale bar, 60 μm. Graph shows data points (circles) and the mean ± SD. n = 12 larvae from 3 independent experiments.
(B) BrdU labeling to test for neurogenesis. Images of a horizontal section through the AOB (stage 44) labeled for BrdU (left) and GABA (right); superimposed image of the same BrdU and GABA channels above, plus DRAQ5, are shown at higher magnification (below). Scale bars, 60 μm (top) and 30 μm (bottom).
(C) Inset in (B) at higher magnification shows a BrdU+GABA+ cell (left, arrow). Quantification of the number of BrdU+GABA+ neurons/10 μm section across non-sibling and sibling raising conditions (below). Scale bar, 20 μm. Graphs show data points (circles) and the mean ± SD. n = 12 larvae from 3 independent experiments. Welch’s t test. ***p ≤ 0.001.
(D) GABAergic Pax6+ reserve pool neurons (arrows) shown in an AOB section triple labeled with antibodies for TH, GABA, and PAX6 (stage 44). Scale bar, 45 μm. Quantification of PAX6+ granule neurons/AOB co-expressing both GABA and TH (yellow) or expressing GABA only (red) or TH only (green) for non-sibling, orphan, and sibling raising conditions. The number of GABAergic neurons that are PAX6− and TH−is also quantified (blue). Granule cells that do not express TH, GABA, or Pax6 were identified by the nuclear marker DRAQ5 (gray, compare with Figure 1C). Graphs show data points (circles) and the mean ± SD. n = 11 larvae from 3 independent experiments. One-way ANOVA (GABA+TH+PAX6+: F(2,30) = 247.5, p < 0.0001; GABA+TH−PAX6+: F(2,30) = 779.1, p < 0.0001; GABA+TH−PAX6−: F(2,30) = 308.4, p < 0.0001; GABA−TH−PAX6−DRAQ5+: F(2,33) = 190, p < 0.0001) with Bonferroni’s multiple comparison test, except TH+GABA−PAX6+, where Kruskal-Wallis with Dunn’s multiple comparison test was used. Comparisons of each subgroup are between the mean of the orphan condition and the means of non-sibling and sibling conditions. *p ≤ 0.05, **p ≤ 0.01, ***p ≤ 0.001.
(E) PAX6-morpholino-injected larvae. Bright field images of the eye phenotype of larvae injected with different morpholino concentrations (left). Scale bar, 100 μm. Quantification of PAX6+ (left) and TH+ (right) granule neurons/AOB of larvae raised in the sibling condition and injected with PAX6-morpholino (blue) or sham (gray). Graphs show data points (circles) and the mean ± SD. n = 11 larvae from 3 independent experiments. Unpaired Student’s t test (PAX6+ cells), Welch’s t test (TH+ cells). ***p ≤ 0.001.
(F) Partial reversibility of dopaminergic plasticity in larvae exposed to the non-sibling raising condition for 24 hr (from stage 39 to stage 42) and then exposed to either sibling or non-sibling raising condition for another 24 hr (stage 42 to stage 44). Quantification of the number of AOB granule neurons that are co-expressing both GABA and TH, GABA only, or TH only. Graphs show data points (circles) and the mean ± SD. n = 11 from 3 independent experiments. One-way ANOVA (GABA+TH+: F(2,30) = 61.91, p < 0.0001; GABA+TH−: F(2,30) = 56.91, p < 0.0001; TH+GABA−: F(2,30) = 28.57, p < 0.0001) followed by Bonferroni’s multiple comparison test. Comparisons of each subgroup are between the mean of the day 1 non-sibling condition and the means of day 2 sibling and non-sibling conditions. ***p ≤ 0.001.
See also Figures S1–S4.
