
Figure 5. Small RNA Profiling Reveals miRs Differentially Regulated by Sustained Kinship Exposure.
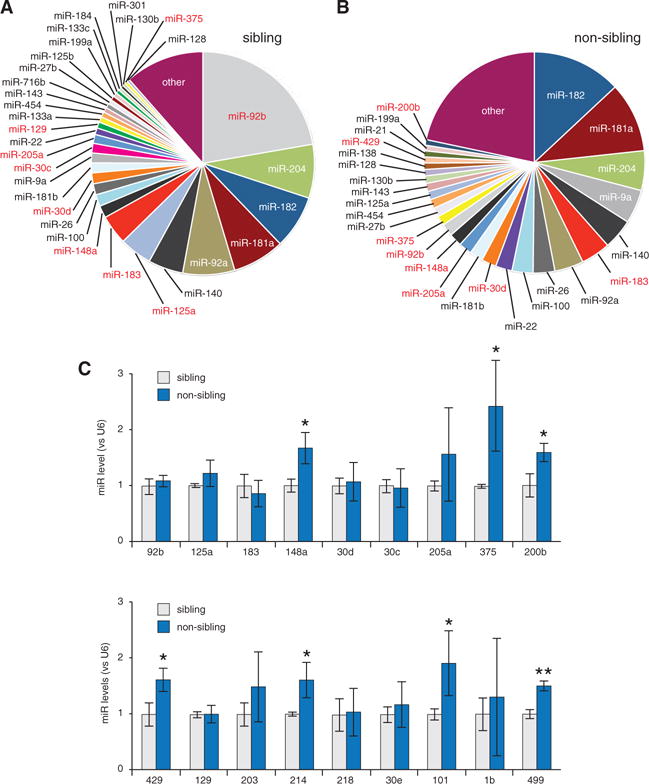
(A) Fractions of total sequenced reads for the indicated miRs in AOB tissue harvested from animals exposed to sibling condition.
(B) Equivalent fractions for exposure to non-sibling condition. Red entries in (A) and (B) were validated by qPCR.
(C) qPCR validation of the top 18 miR candidates. miR-148a, miR-375, miR-200b, miR-429, miR-214, miR-101, and miR-499 are significantly different in non-sibling versus sibling conditions. Graphs show the mean ± SD. n = 3 independent experiments with 15 AOB samples per condition, except miR-375 and miR-200b: n = 5. Unpaired Student’s t test. *p ≤ 0.05; **p ≤ 0.01.
See also Figure S7.