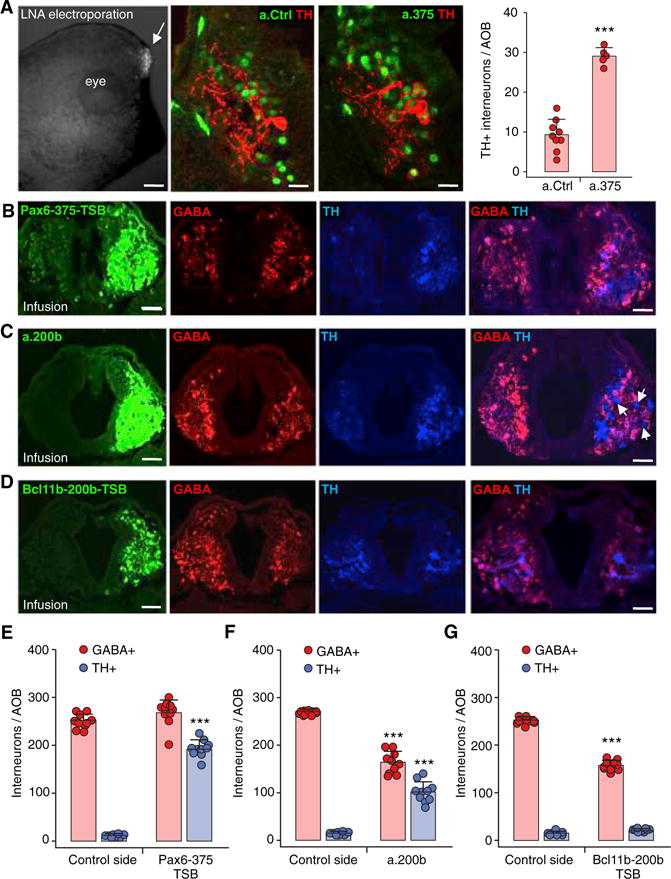
Figure 7. miR-375 and miR-200b Inhibitors Regulate Neurotransmitter Expression.

(A) Electroporation of 6-carboxyfluroscein (FAM)-tagged antagonists (LNA) in the AOB performed on stage 21 larvae raised in non-sibling conditions and scored at stage 33 (left, arrow). Images demonstrate a.375 blockade, compared to a.Ctrl, of the reduction in dopaminergic phenotype (TH) normally induced by non-kin exposure (middle). Quantification of the number of TH+ interneurons/AOB (right) following electroporation of miR antagonists (a.375 and a.200b) and control LNA (a.Ctrl). Scale bars, 300 μm (left), 30 μm (middle). Graph shows the mean ± SD. n = 5 larvae from 3 independent experiments. ***p < 0.001.
(B) Infusions of in vivo ready Pax6-375-TSB in the AOB performed on stage 39 larvae raised in non-sibling conditions and analyzed in stage 42 larvae (left). AOB sections immunostained for GABA and TH show the Pax6-375-TSB-mediated block on the infused side of the reduction in dopaminergic phenotype normally induced by non-kin exposure, which is still observed on the control side. Scale bars, 40 μm (3 left panels), 50 μm (right).
(C) Infusions of in vivo ready miR antagonist a.200b in the AOB performed on stage 39 larvae raised in non-sibling conditions and analyzed at stage 42 (left). AOB sections immunostained for GABA and TH show the simultaneous blocking by a.200b of both the reduction in dopaminergic phenotype and the induction of the GABAergic phenotype normally caused by non-kin exposure; these effects are confined to the infused side and do not extend to control side. Scale bars, 40 μm (3 left panels), 50 μm (right).
(D) Infusions of in vivo ready Bcl11b-200b-TSB in the AOB performed on stage 39 larvae raised in non-sibling conditions and analyzed in stage 42 larvae (left). AOB sections immunostained for GABA and TH show Bcl11b-200b-TSB-mediated blockade of the increased GABAergic phenotype normally induced by non-kin exposure. There is no effect on TH expression, and the GABAergic block does not extend to the control side. Scale bars, 40 μm (3 left panels), 50 μm (right).
(E) The number of TH+ and GABA+ interneurons/AOB following infusion of in vivo ready Pax6-375-TSB compared to the control side.
(F) The number of TH+ and GABA+ interneurons/AOB following infusion of in vivo ready miR antagonist a.200b compared to the control side.
(G) The number of TH+ and GABA+ interneurons/AOB following infusion of in vivo ready Bcl11b-200b-TSB compared to the control side.
(E–G) Graphs show data points (circles) and the mean ± SD. n = 10 larvae from 3 independent experiments. Unpaired Student’s t test, except for (E), (F), and (G) GABA+, where Mann-Whitney U test was used. ***p ≤ 0.001.
See also Figure S7A.
