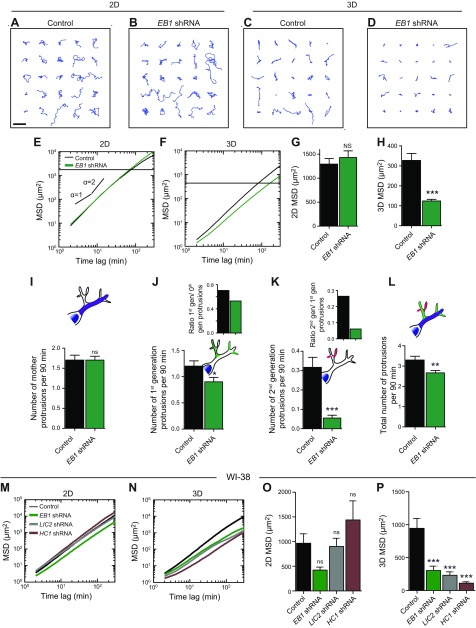
Figure 3.
The distinct role of EB1 in 3D cell migration. A–D). Typical trajectories of 25 individual control and EB1-depleted cells migrating on collagen I–coated 2D substrates and inside 3D collagen I matrices. Scale bar, 200 µm. E, F). shRNA-mediated depletion of EB1 has an inhibitory effect on cell migration in cells migrating in collagen I matrices (F) but has no significant effect on cell migration on substrates (E). G, H). Regulation of migration for cells on 2D substrates and embedded in 3D collagen I matrices by EB1. MSDs were evaluated at a time scale of 1 h. I). Total number of mother protrusions (zeroth-generation protrusions) generated per 90 min per cell. J, K). Number of first-generation protrusions (J) and second-generation protrusions (K) generated per 90 min per cell. Insets: Number of first-generation protrusions per mother protrusion (J); number of second-generation protrusions per first-generation protrusion (K). L). Total number of protrusions generated per 90 min per cell. For all panels, cells were monitored for 16.5 h. M, N). MSD plots for WI-38 cells depleted of EB1, LIC2, and HC1 moving on 2D substrates (M) and inside collagen I matrix (N). O, P). MSDs for WI-38 cells evaluated at a time scale of 1 h for cells on 2D substrates (O) and inside 3D matrix (P). For each condition, n = 3; at least 60 cells were probed for cell migration analysis, and at least 40 cells were probed for protrusion topology analysis. Ns, not significant. **P < 0.01, ***P < 0.001.

