
Figure 3.
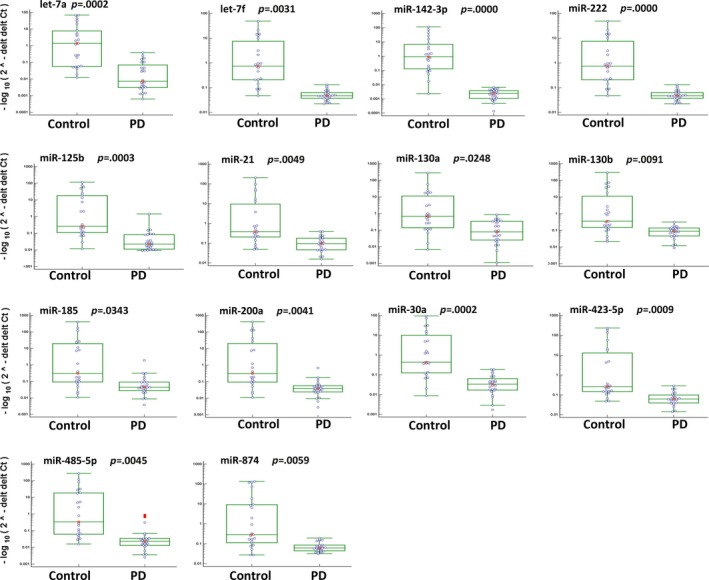
Scatter plot showing the expression levels of indicated miRNAs in all the tested samples. These miRNAs showed at least two folds less in the plasma of PD‐diagnosed patients than healthy controls, and adjusted p values ≤.05. The Mann–Whitney test was used for statistical analysis using IBM SPSS Statistics 21.0 software